Gold, Chart of the Week: XAU/USD bulls creep on to the backside of daily bearish trend

In last week's analysis, Gold, Chart of the Week: XAU/USD bulls eye $1,950 but bears stay in charge, the dominant bearish trendline on the daily chart as illustrated below was the key feature that was expected to keep the bulls at bay.
Gold prior analysis
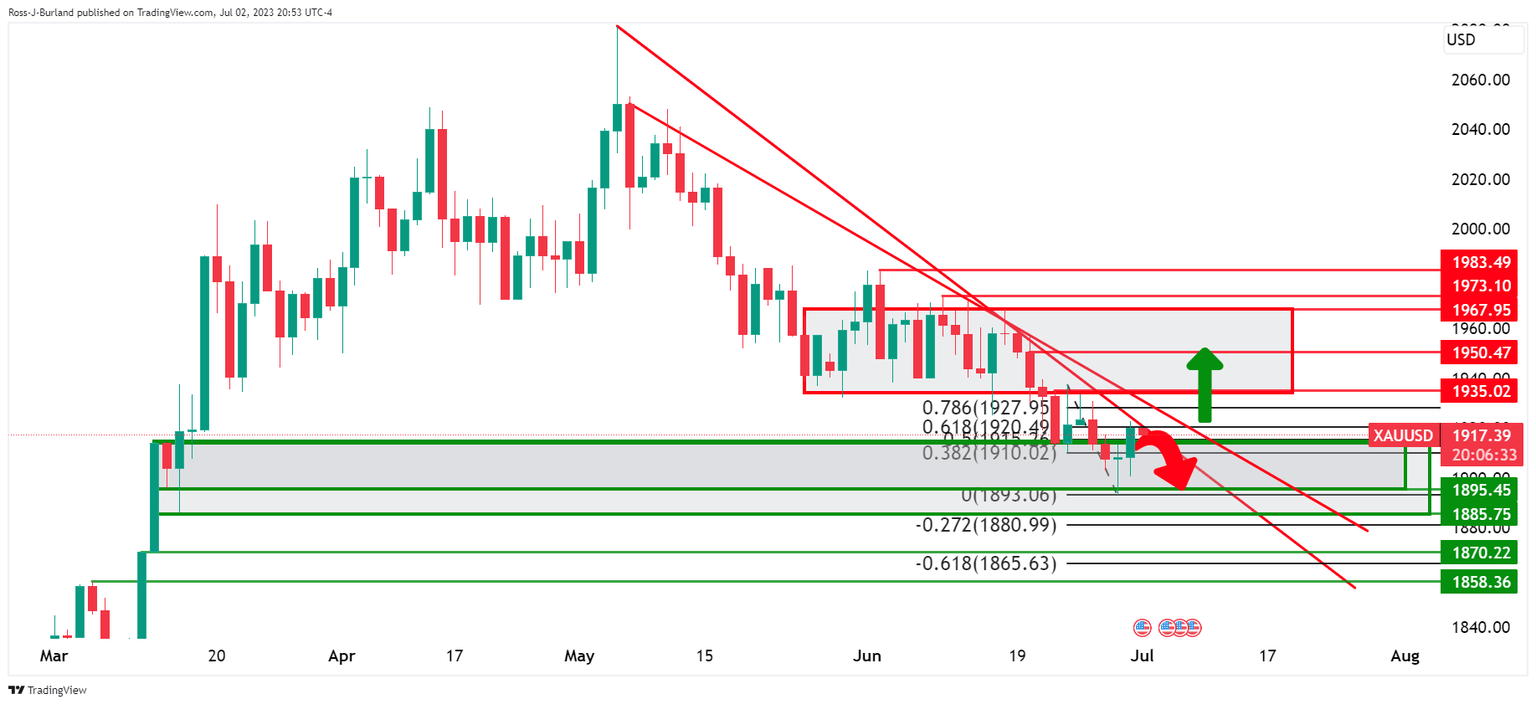
This left the focus on a downside continuation while on the front side of the bearish dynamic trend lines. We saw a new low to $1,893.
Gold price updates
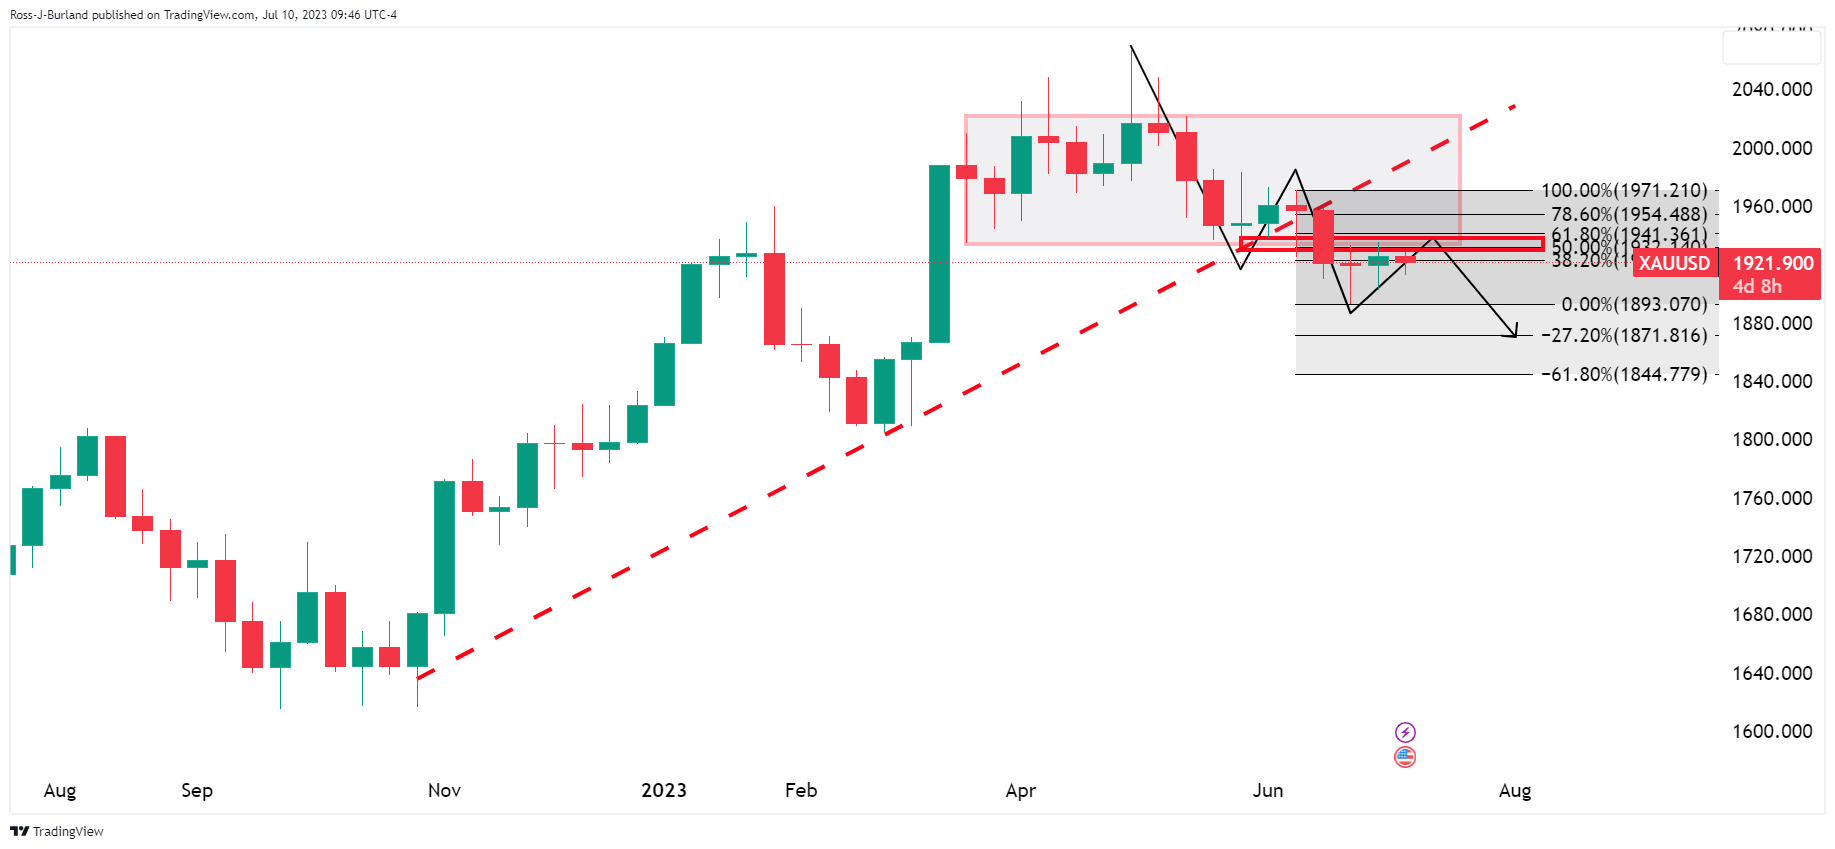
The weekly chart remains bearish.

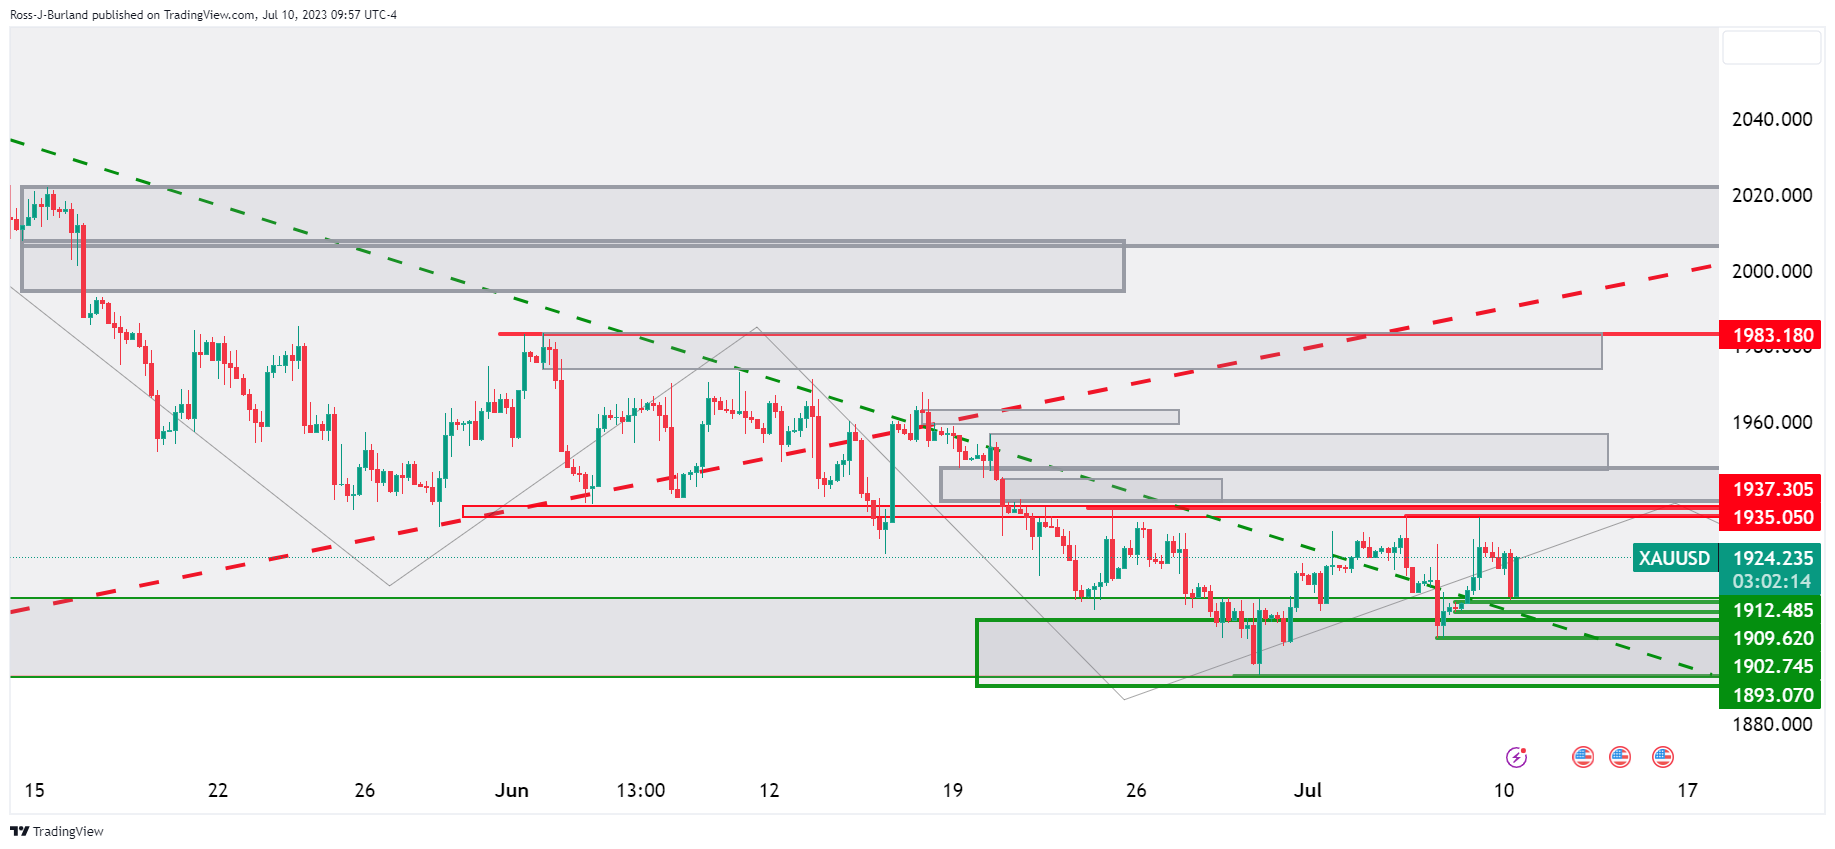
The daily chart shows the price coiled between resistance and support but now sliding out of the daily bearish trendline resistance.
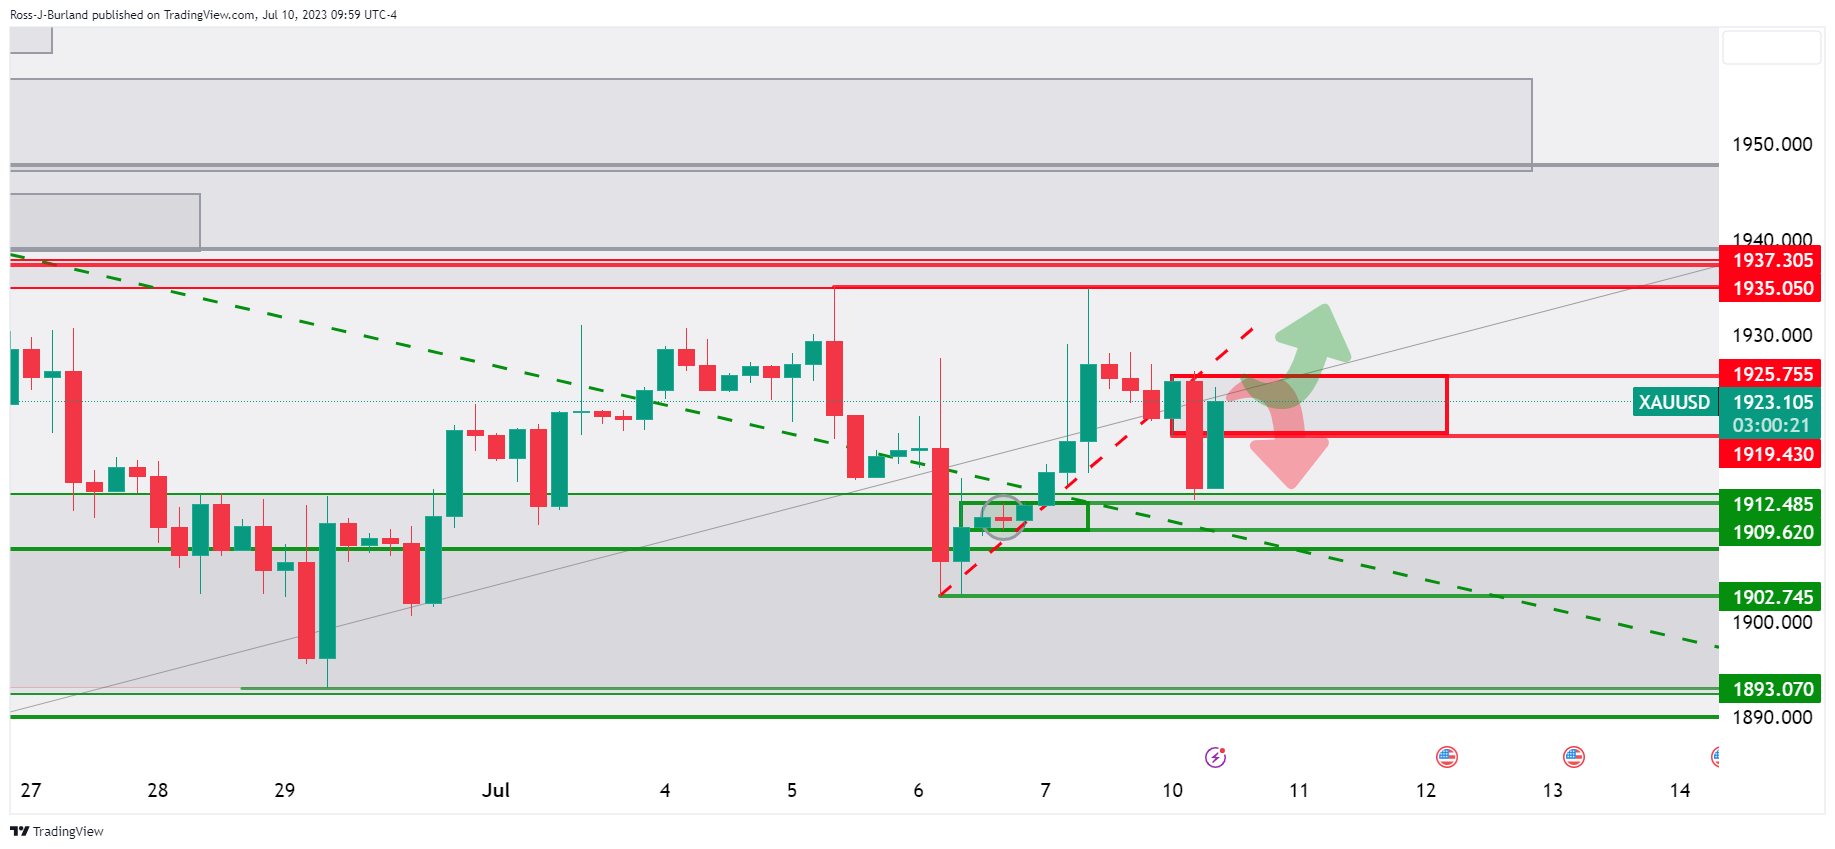
The 4-hour charts show the price biased lower for a test of the $1,900s again so long as $1,925 holds. If we see a break of $1,925, given that the price is creeping outside of the daily trendline resistance, there will be prospects of latest of the 4-hour and daily imbalances towards $1,983 resistance.
Premium
You have reached your limit of 3 free articles for this month.
Start your subscription and get access to all our original articles.
Author

Ross J Burland
FXStreet
Ross J Burland, born in England, UK, is a sportsman at heart. He played Rugby and Judo for his county, Kent and the South East of England Rugby team.


