Gold, Chart of the Week: XAU/USD bears seek break of $1,770
- Gold bears are back in the driving seat, testing a weekly support area.
- 4-hour price action momentum could evolve into a break to test $1,770 in coming sessions.

The price of gold is teasing a breakout below the $1,800s for the week ahead. The bears have taken back control since the bulls failed to overcome the $1,834 critical resistance level.
The following is a top-down analysis to illustrate the bias on a break of weekly support.
Gold, weekly chart
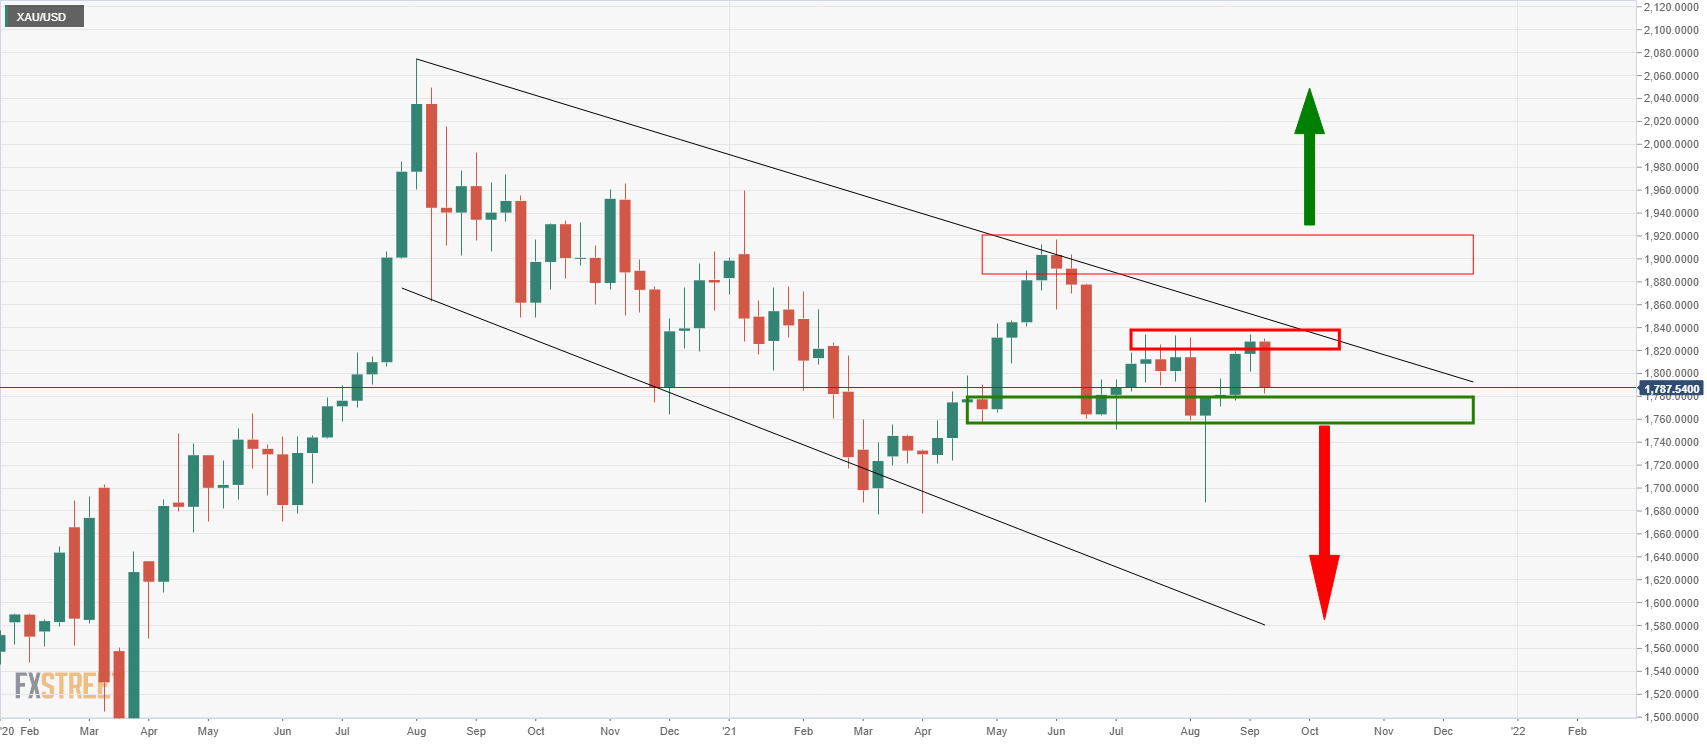
The gold bulls were taking on the bears at a critical level of resistance, $1,834 last week but failed and the price is moving in on weekly support near $1,780. This is an area of demand, so initial tests could fail and see the price move sideways in consolidation.
On the upside, should the gold price break $1,834, the critical trend line resistance of the descending channel will be under pressure. The $1,900s will be next in line as a key psychological and structural target area.
Gold, daily chart
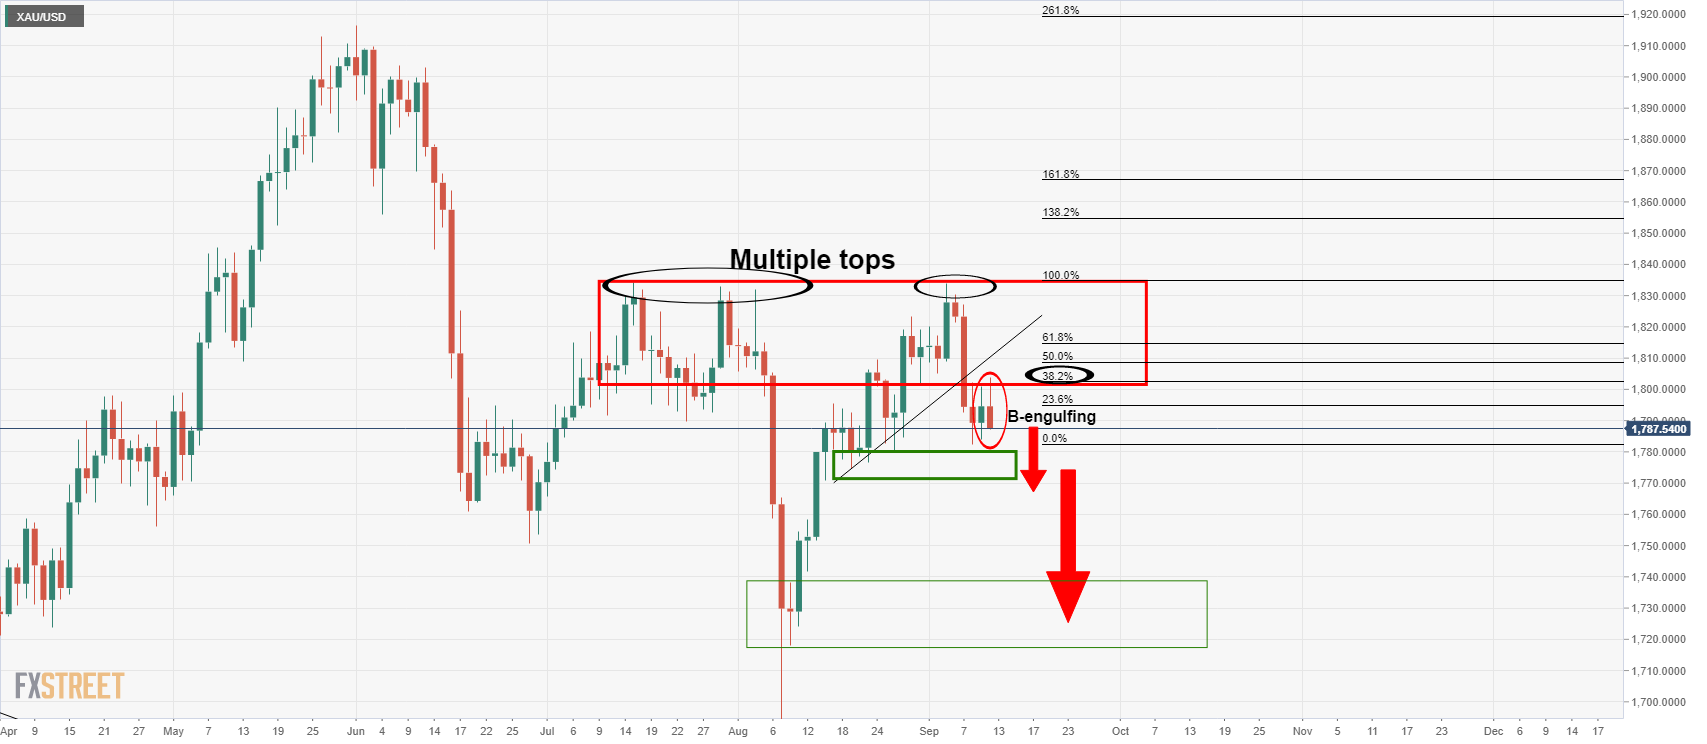
On the daily time frame, gold's dynamic trendline support was broken following a strong candle to the downside. There is momentum in the move and a bearish engulfing candle formation is present following a 38.2% ratio correction in the gold price. This would ideally be followed by subsequent candles to confirm the bearish bias.
Gold, 4-hour chart
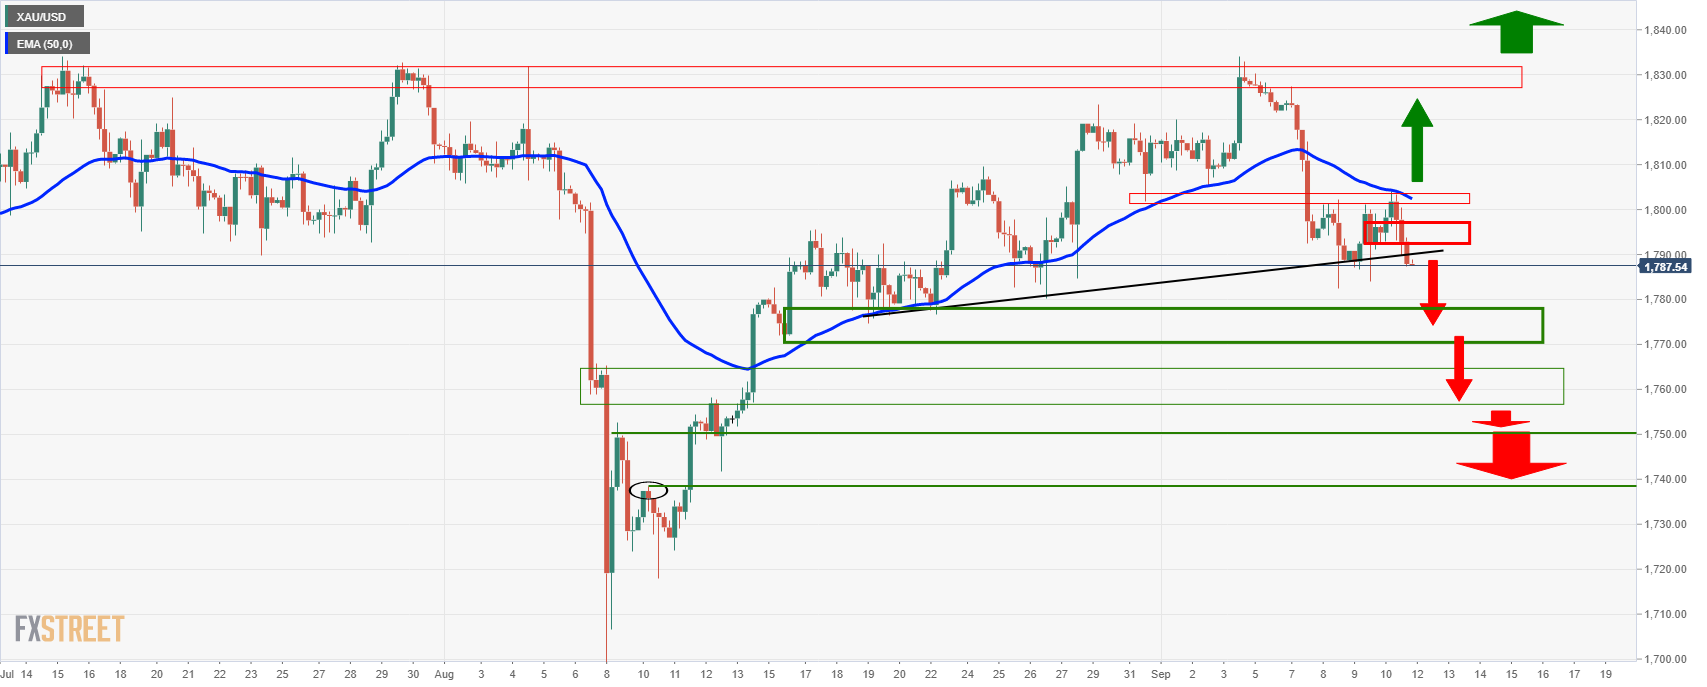
With that being said, the gold price is breaking out below the 50 EMA on the 4-hour chart and has subsequently broken a minor dynamic support line. Given the momentum, the gold price would be expected to take out the support between $1,780 and $1,770 and head lower towards $1,750 and then $1,738.
Premium
You have reached your limit of 3 free articles for this month.
Start your subscription and get access to all our original articles.
Author

Ross J Burland
FXStreet
Ross J Burland, born in England, UK, is a sportsman at heart. He played Rugby and Judo for his county, Kent and the South East of England Rugby team.


