Gold, Chart of the Week: The bulls are up against strong headwinds
- Gold was pressured by the end of last week potentially putting a cap on the bull trend.
- The price has a few bucks to go until it mitigates a price imbalance, but fundamentals are in the way.

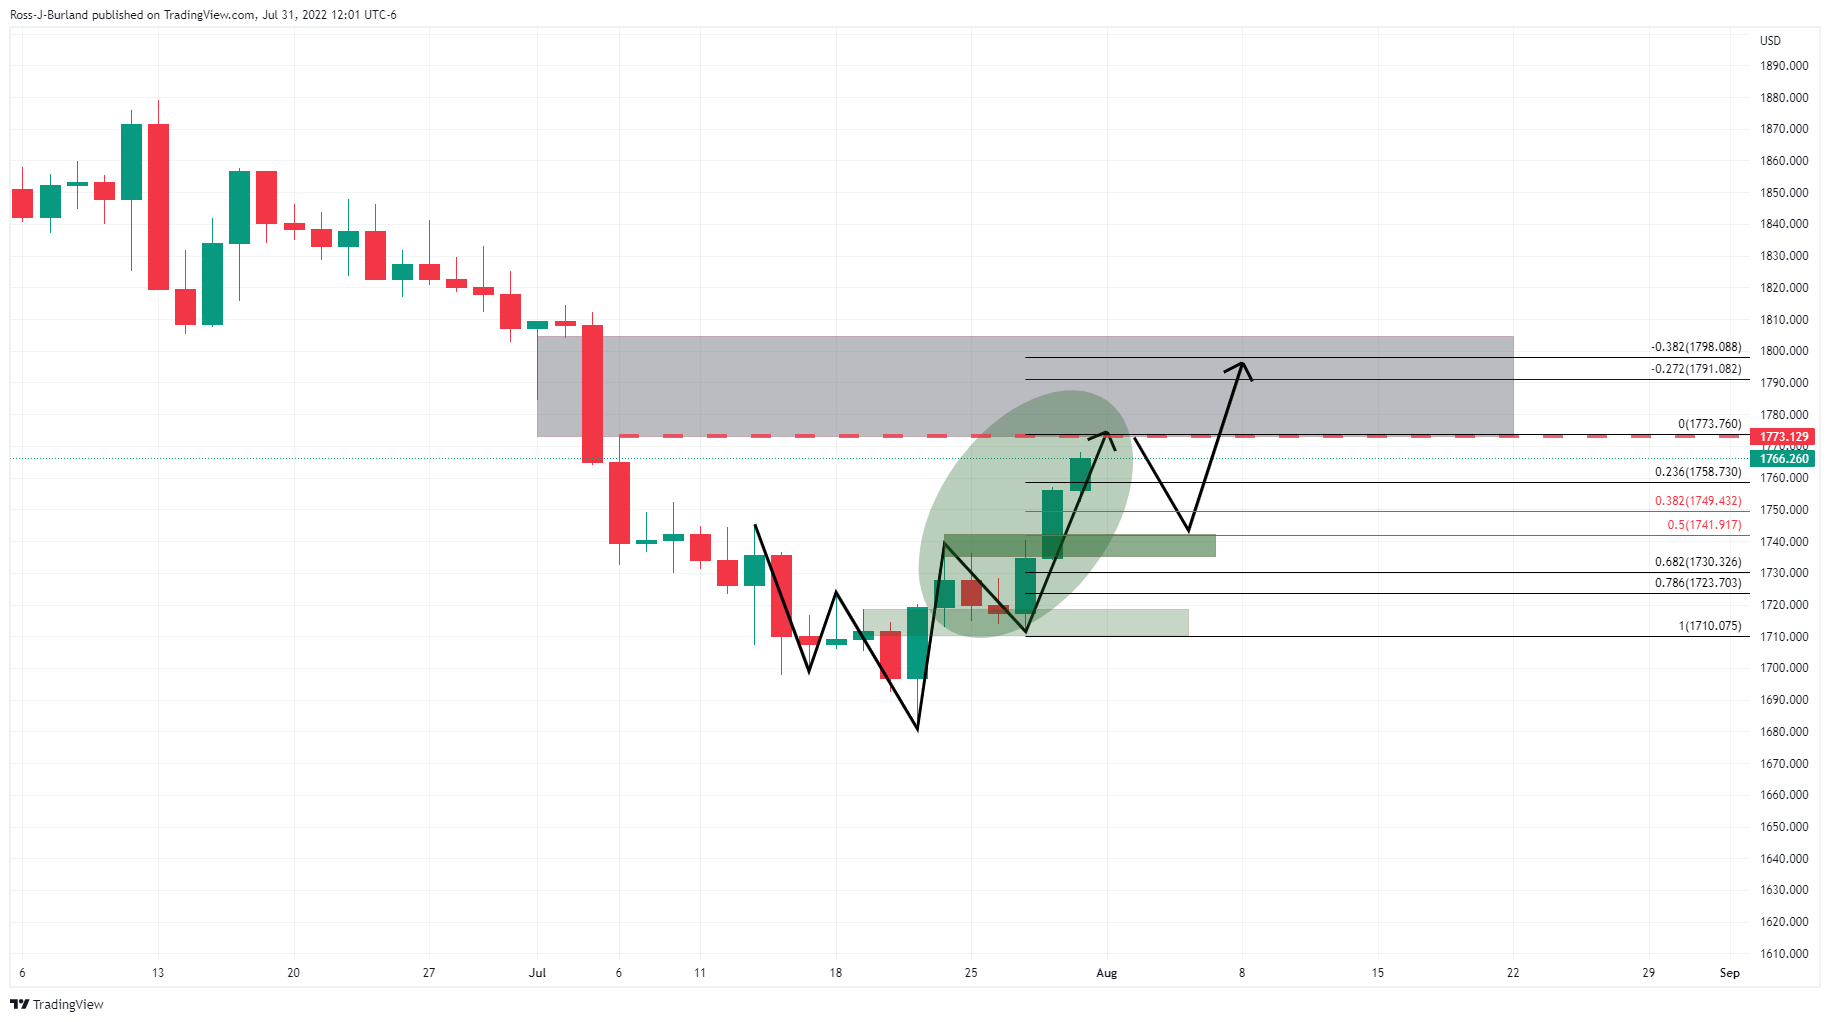
As per last week's pre-open gold analysis, Gold, Chart of the Week: Bulls move in on critical recovery area, eye $1,800s, XAU/USD came within around $5.00 of the $1,800 target with a high just shy of the golden 61.8% ratio.
Gold, prior analysis, daily chart
Gold, live market
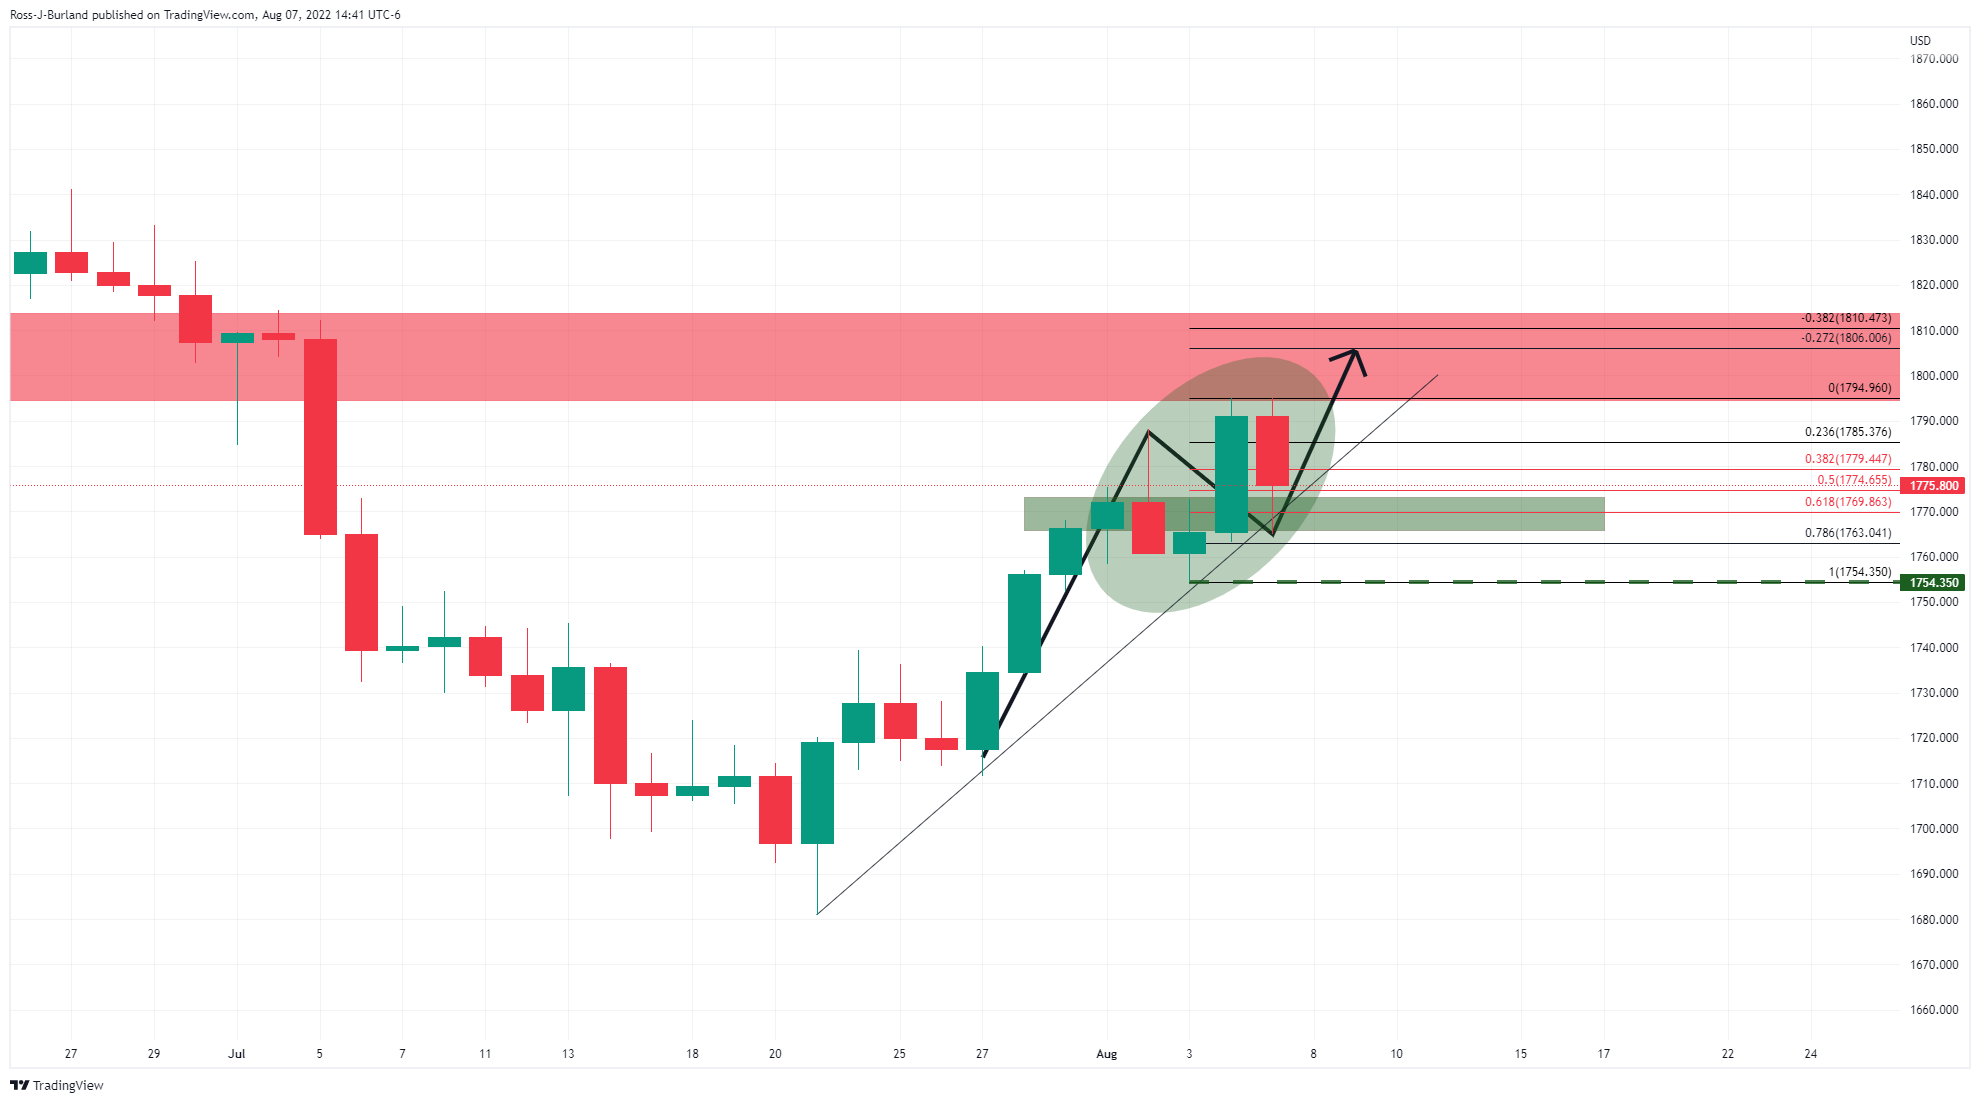
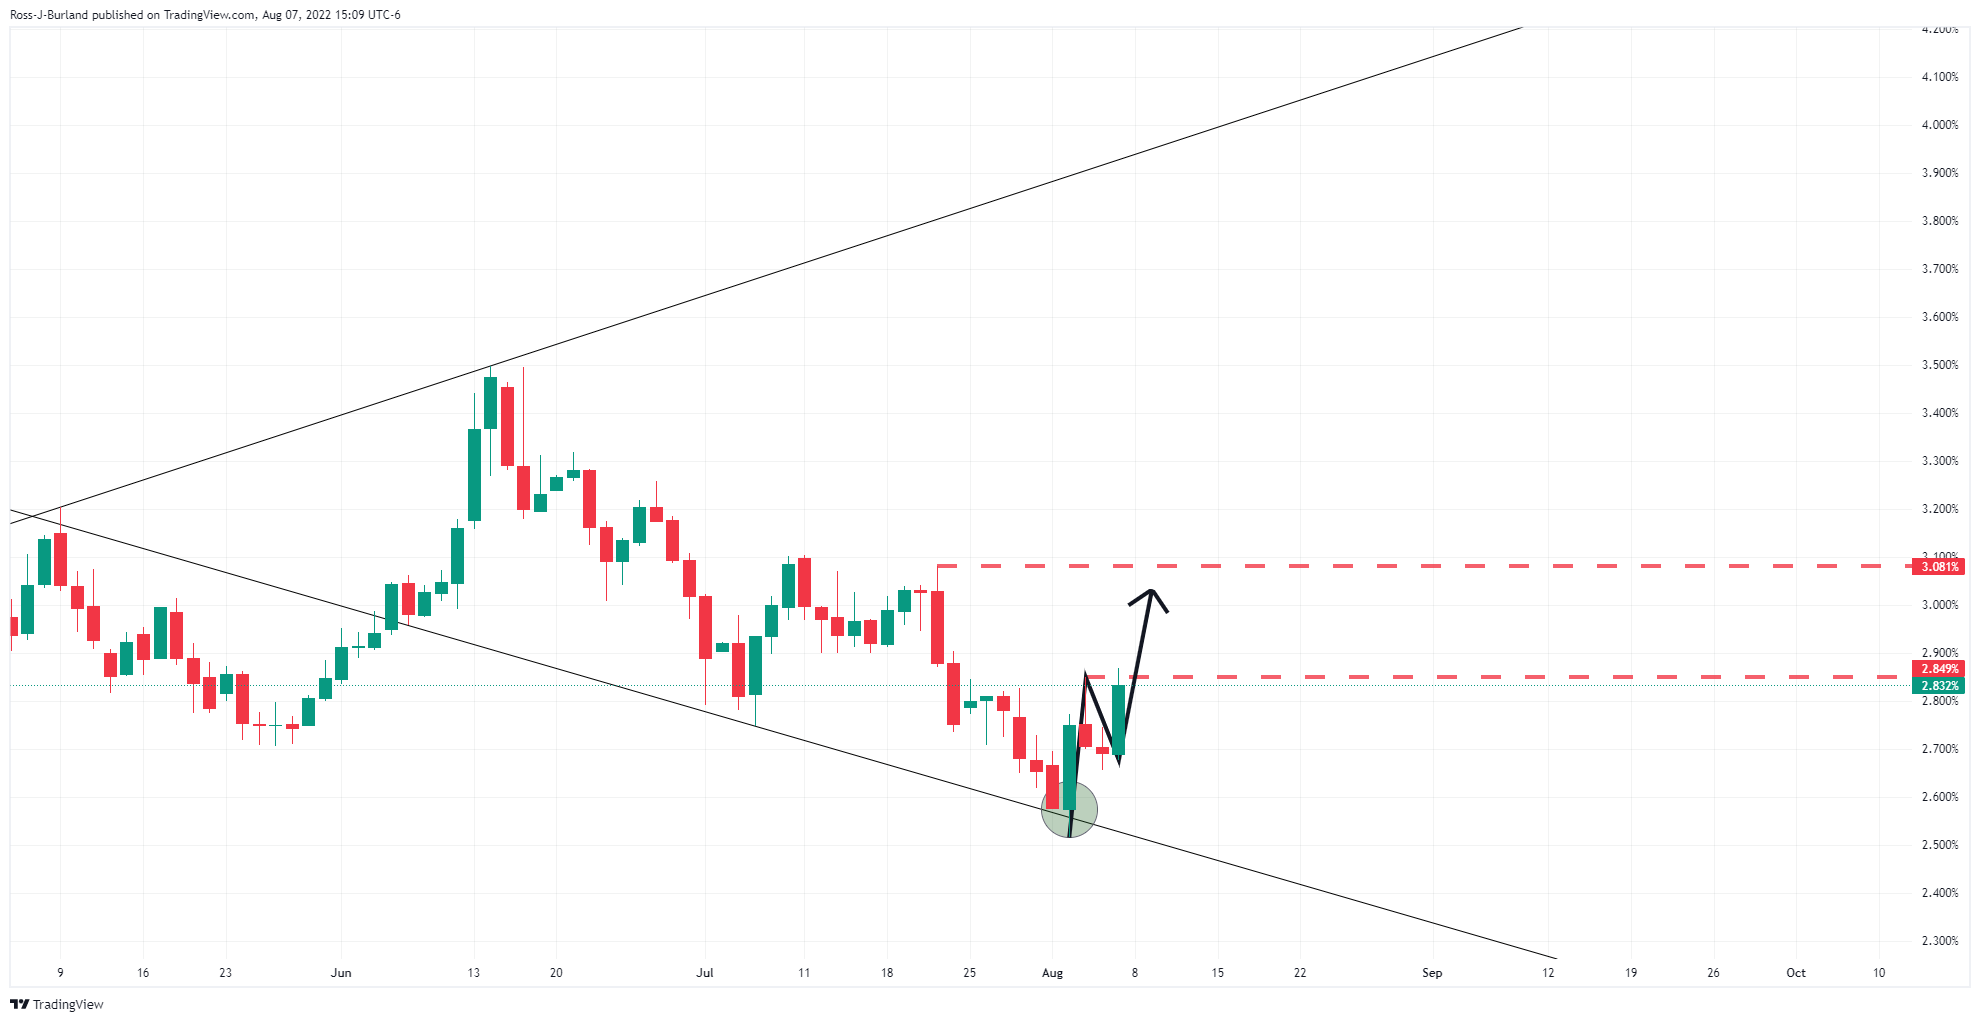
It was explained for last week's open that profit taking was a probable scenario which would result in a pullback in the price ''prior to the next potential move higher in order to mitigate the price imbalance between $1,772 and $1,804.'' This is what we got which has left $1,754 as a key structure in the market for the week ahead.
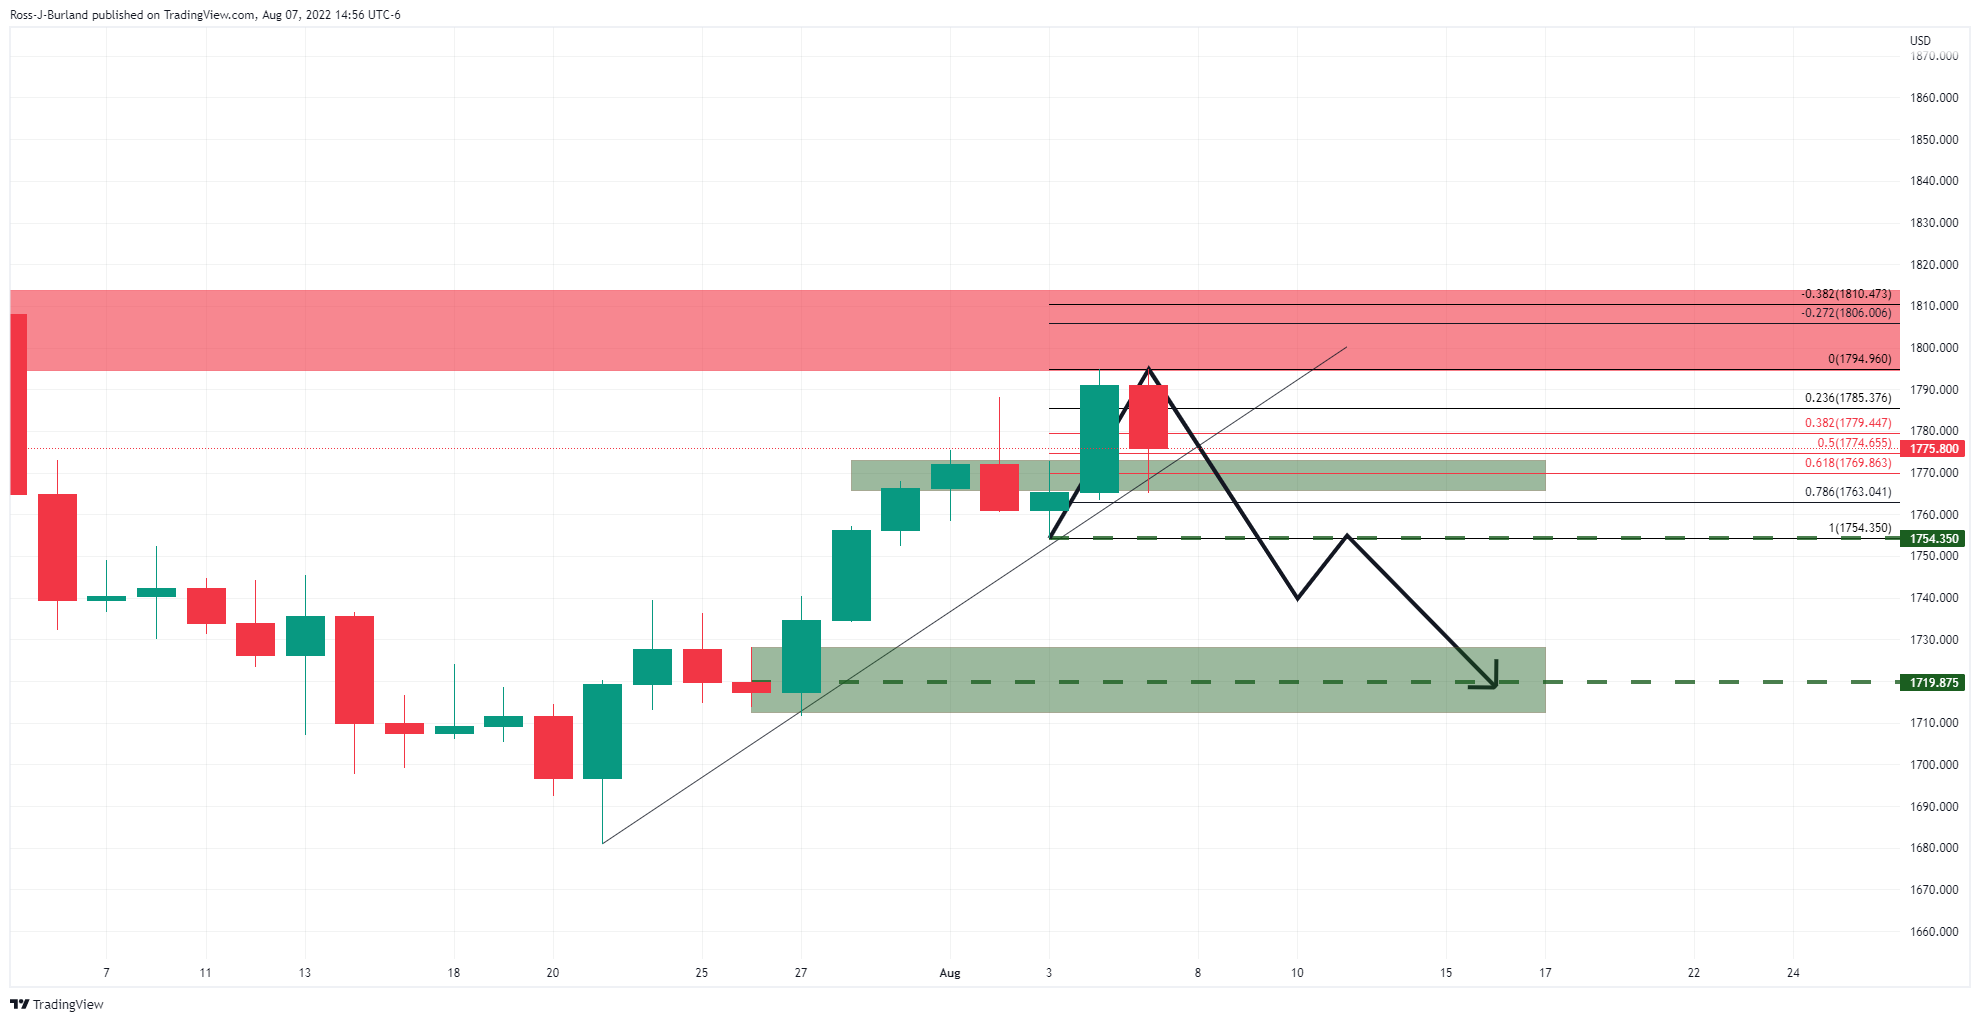
So long as the bulls commit at this juncture, the price will be respecting the trendline support and the cluster of key Fibonaccis of the prior bullish impulse. However, a break of $1,754 opens the risk of a significant move to the downside with $1,720 eyed:
Meanwhile, the weekly chart's 61.8% Fibonacci aligns with the M-formation as follows:
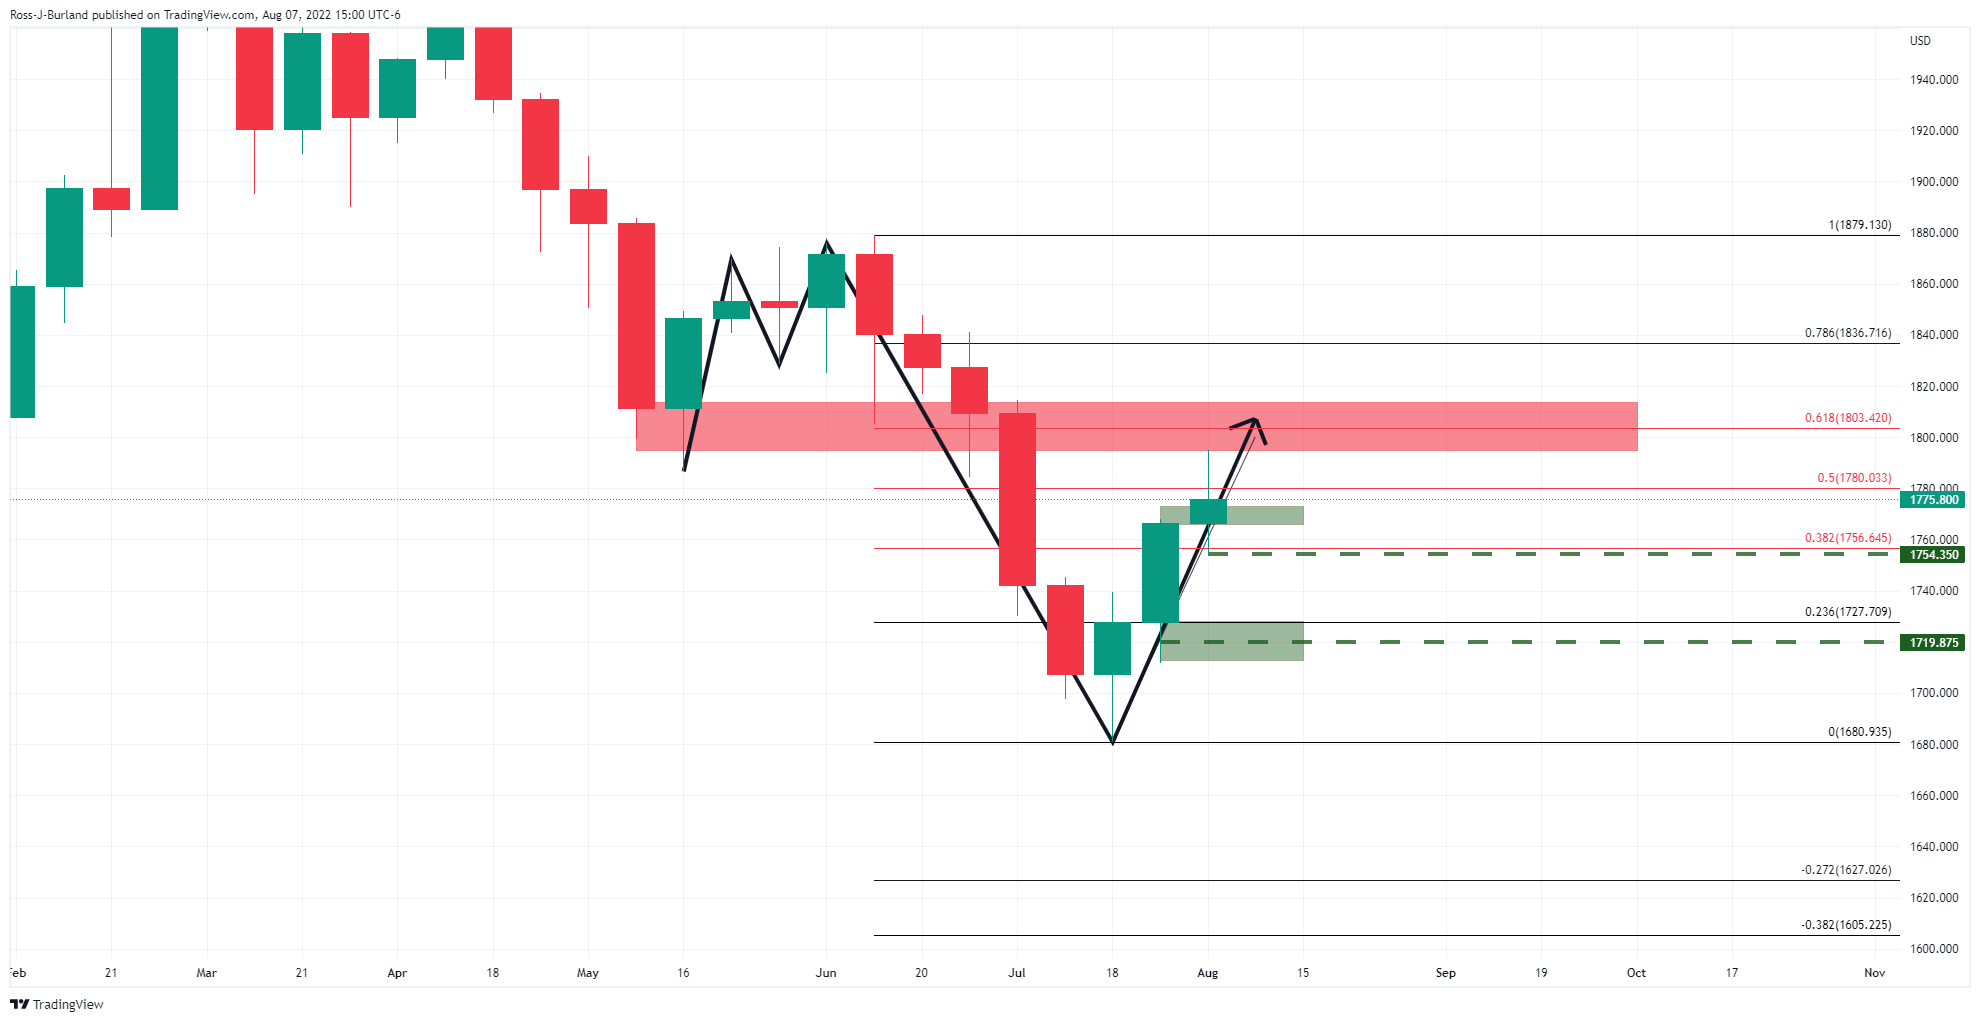
The M-formation is a reversion pattern that has pulled the price into the neckline resistance. Last week's candle has a bearish demeanour but the bulls are still in play for the week ahead as illustrated on the daily chart. However, fundamentals are opposing.
With 'the July payrolls report showing more than 500k job growth, near-record unemployment and outsized wage growth, the gold rally started to reverse on Friday,'' analysts at TD Securities explained.
''With the possibility that the US economy will continue to stay firm, and generating upward inflation pressures, rates popped, and gold fell. This suggests that the recent increases in net positioning should reverse. Economic data such as the Consumer Price Index next week may well serve as a catalyst for more downside, should inflation not look to be under control.''
This would tie in with the following technical analysis on the US 10-year treasury yields and the rally from broadening formation's support:
Premium
You have reached your limit of 3 free articles for this month.
Start your subscription and get access to all our original articles.
Author

Ross J Burland
FXStreet
Ross J Burland, born in England, UK, is a sportsman at heart. He played Rugby and Judo for his county, Kent and the South East of England Rugby team.


