|

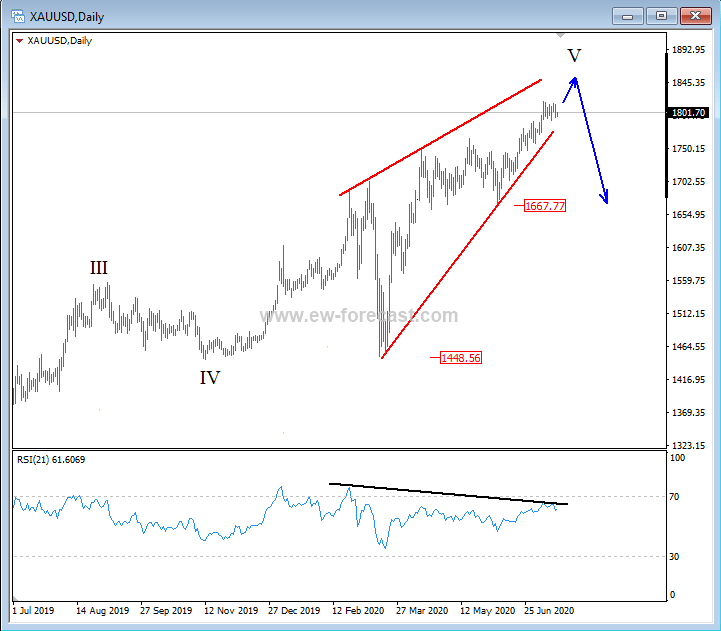
Gold can face resistance near-term – Elliott wave analysis

GOLD is looking bullish, however on the daily chart we see price in final stages of a bigger Elliott wave ending diagonal. An Elliott wave ending diagonal is a reversal pattern, and can once completed, push price into a sharp reversal. In our case we expect to see a three-wave A-B-C move, once wave V fully develops.

The Elliott wave ending diaognal will be completed, once we see a sharp drop below the lower Elliott wave ending diagonal line, and below the 1667 level.

Also, for further indication that the price can turn lower in days or weeks ahead can be a divergence on the Relative strength index below the chart.

Gold, daily

Gold

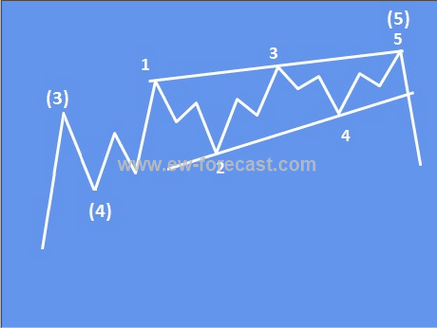
An ending diagonal is a special type of pattern that occurs at times when the preceding move has gone too far too fast, as Elliott put it. A very small percentage of ending diagonals appear in the C wave position of A-B-C formations. In double or triple threes, they appear only as the final “C” wave. In all cases, they are found at the termination points of larger patterns, indicating exhaustion of the larger movement.

  • structure is 3-3-3-3-3.

  • a wedge shape within two converging lines.

  • wave 4 must trade into a territory of a wave 1.

  • appears primarily in the fifth wave position, in the C wave position of A-B-C and in double or triple threes as the final “C” wave.

Example of an Elliott wave ending diagonal:

fxsoriginal

Interested in our services? Visit us at www.ew-forecast.comand try our 7-day Trial service, and get actionable Elliott Wave charts today.

Author

Gregor Horvat

Gregor Horvat

Wavetraders

Experience Grega is based in Slovenia and has been in the Forex market since 2003.

More from Gregor Horvat
Share:

Editor's Picks

EUR/USD: US Dollar to remain pressured until uncertainty fog dissipates

Unimpressive European Central Bank left monetary policy unchanged for the fifth consecutive meeting. The United States first-tier employment and inflation data is scheduled for the second week of February. EUR/USD battles to remain afloat above 1.1800, sellers moving to the sidelines.

GBP/USD reclaims 1.3600 and above

GBP/USD reverses two straight days of losses, surpassing the key 1.3600 yardstick on Friday. Cable’s rebound comes as the Greenback slips away from two-week highs in response to some profit-taking mood and speculation of Fed rate cuts. In addition, hawkish comments from the BoE’s Pill are also collaborating with the quid’s improvement.

Gold jumps above $5,000 as China's gold buying drives demand

Gold price rises to near $5,035 during the early Asian session on Monday. The precious metal extends its recovery amid a weaker US Dollar and rising demand from central banks. The delayed release of the US employment report for January will be in the spotlight later on Wednesday.

Week ahead: US NFP and CPI data to shake Fed cut bets, Japan election looms

US NFP and CPI data awaited after Warsh’s nomination as Fed chief. Yen traders lock gaze on Sunday’s snap election. UK and Eurozone Q4 GDP data also on the agenda. China CPI and PPI could reveal more weakness in domestic demand.

Three scenarios for Japanese Yen ahead of snap election

The latest polls point to a dominant win for the ruling bloc at the upcoming Japanese snap election. The larger Sanae Takaichi’s mandate, the more investors fear faster implementation of tax cuts and spending plans. 

XRP rally extends as modest ETF inflows support recovery

Ripple is accelerating its recovery, trading above $1.36 at the time of writing on Friday, as investors adjust their positions following a turbulent week in the broader crypto market. The remittance token is up over 21% from its intraday low of $1.12.