Gold bullish outlook amid global financial uncertainty

The gold market has recently experienced a rebound from a strong long-term support level and continues to trade higher. This bullish outlook in the gold market can be traced back to the 10th of March 2023, when the collapse of Silicon Valley Bank initiated a global financial crisis. The potential recession in 2023 is expected to further accelerate gold demand, potentially breaking key levels observed over the past few months.
Technical analysis of the Gold market
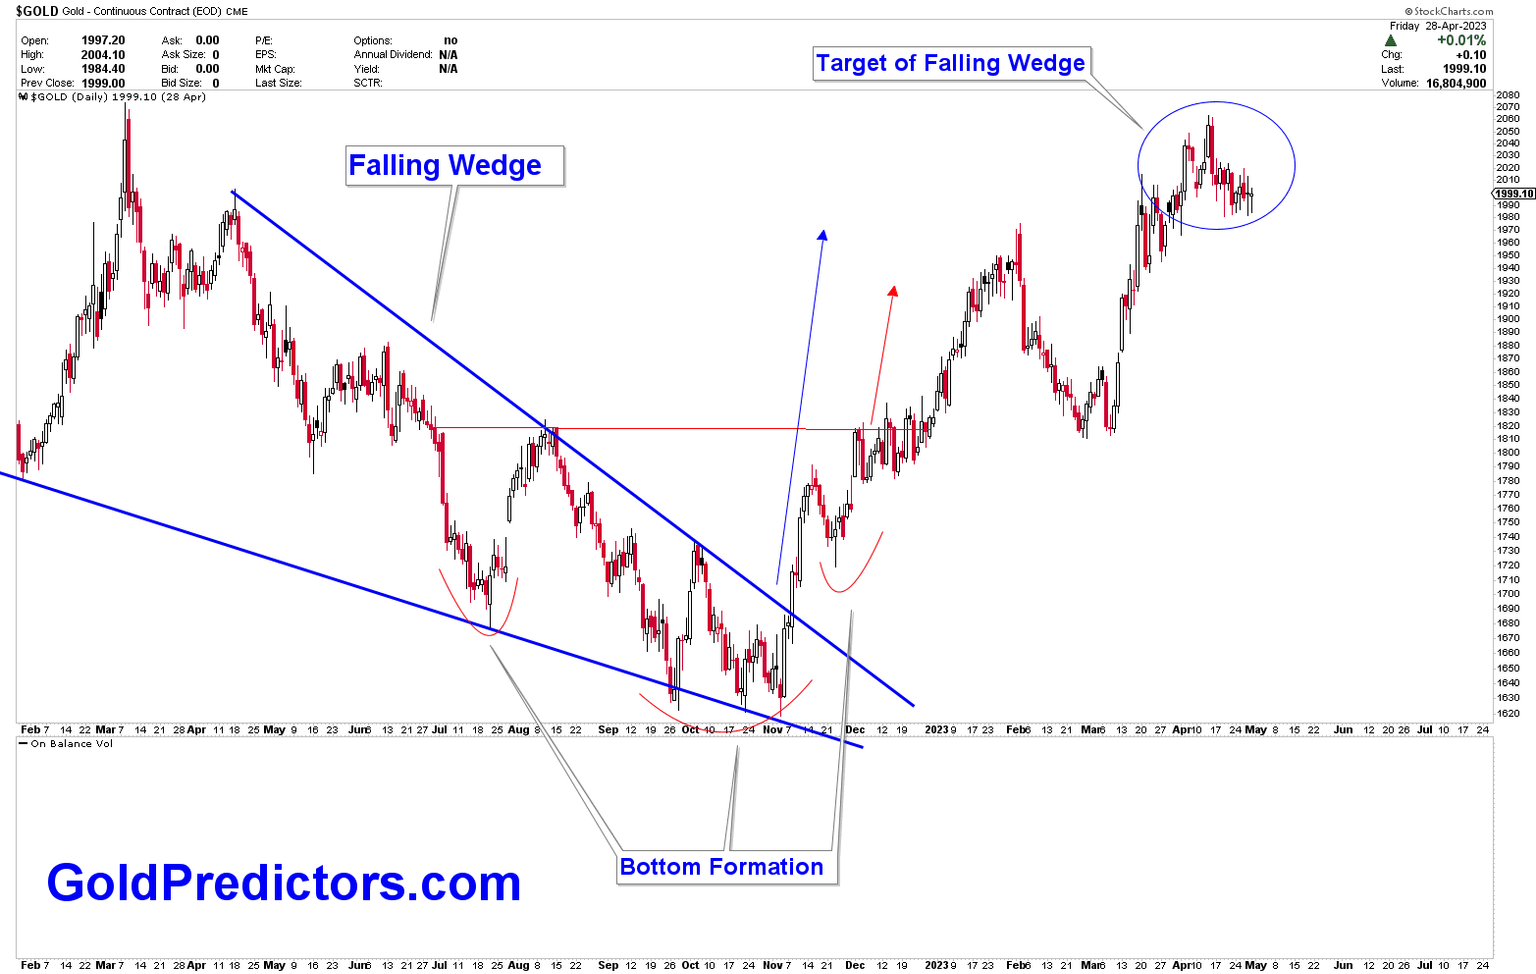
A falling wedge pattern was previously identified in the gold market, which signaled a bullish outlook and a target price range of $1,975 to $2,075. The emergence of an inverted head and shoulders pattern further supported the bullish trend, targeting the same price range. As anticipated, the price broke higher and reached the target, as demonstrated in the chart below.
Gold daily chart
The chart also highlights the 10 and 20-month moving averages, indicating a bullish trend in the market as the price trades above both moving averages. With the Relative Strength Index (RSI) above 50 and the price above the 10 and 20-month averages, the gold market remains strongly bullish. The key level of $2,075 has been discussed repeatedly, and it is likely that the price will break through this level in the near future.
Gold monthly chart
Key actions for traders
As the gold price has hit the key level of $2,075, a correction to lower levels is expected before breaking higher. Traders can take advantage of this potential correction by entering long positions in the gold market. Strong support exists around the $1,900 region, where traders can execute long positions targeting higher levels. The chart below illustrates the channel within which the price is moving. Any correction may also reach the lower support line of this channel at the $1,890 to $1,920 levels, providing a strong support base in the gold market. If the price breaks through the $2,075 level, the gold market will generate a strong buy signal targeting significantly higher levels.
Gold Daily Chart
Bottom Line
The gold market has shown resilience and bullish momentum in light of the recent global financial crisis. The technical analysis reveals a positive outlook for gold, with key levels and support zones identified for traders to consider. As the possibility of a recession in 2023 looms, gold demand is expected to grow, further bolstering the bullish trend. By closely monitoring the market and acting on the key levels and support zones identified, traders can capitalize on the opportunities presented in the gold market amid global financial uncertainty.
Unlock exclusive gold and silver trading signals and updates that most investors don’t see. Join our free newsletter now!
Author

Muhammad Umair, PhD
Gold Predictors
Muhammad Umair is a financial markets analyst and investor who focuses on the forex and precious metals markets.


