Gold and Silver’s Stormy September

There were only a few analyses that we started with a quote, and there were even fewer that we began by quoting a song. It may even be the first one ever.
I am the storm and I am the wonder
And the flashlights, nightmares
And sudden explosions
Royksopp, “What Else Is There”
And you will have all the above in September. At least if you’re going to pay attention to gold, silver and mining stocks.
We warned that the key factors had been in place for a long time and those who were willing to listen, have already positioned themselves accordingly. The multiple bearish confirmations, like the steady rise in the gold to silver ratio and the underperformance of mining stocks, have been repeated over and over again. And it looks like PMs are ready to take the main dive. Yes, gold will very likely soar to new highs, but not before an epic decline. Are you prepared?
In the early part of the previous week, the USD Index moved lower, while the precious metals sector moved higher. But, right before the end of the week, we saw that it was just a trap for those who really wanted to see gold rallying instead of objectively observing what was going on and unemotionally acting on the observations. Let’s take a look at the facts, starting with the USD Index chart (chart courtesy of http://stockcharts.com).
Breakdown? You Mean Breakout?
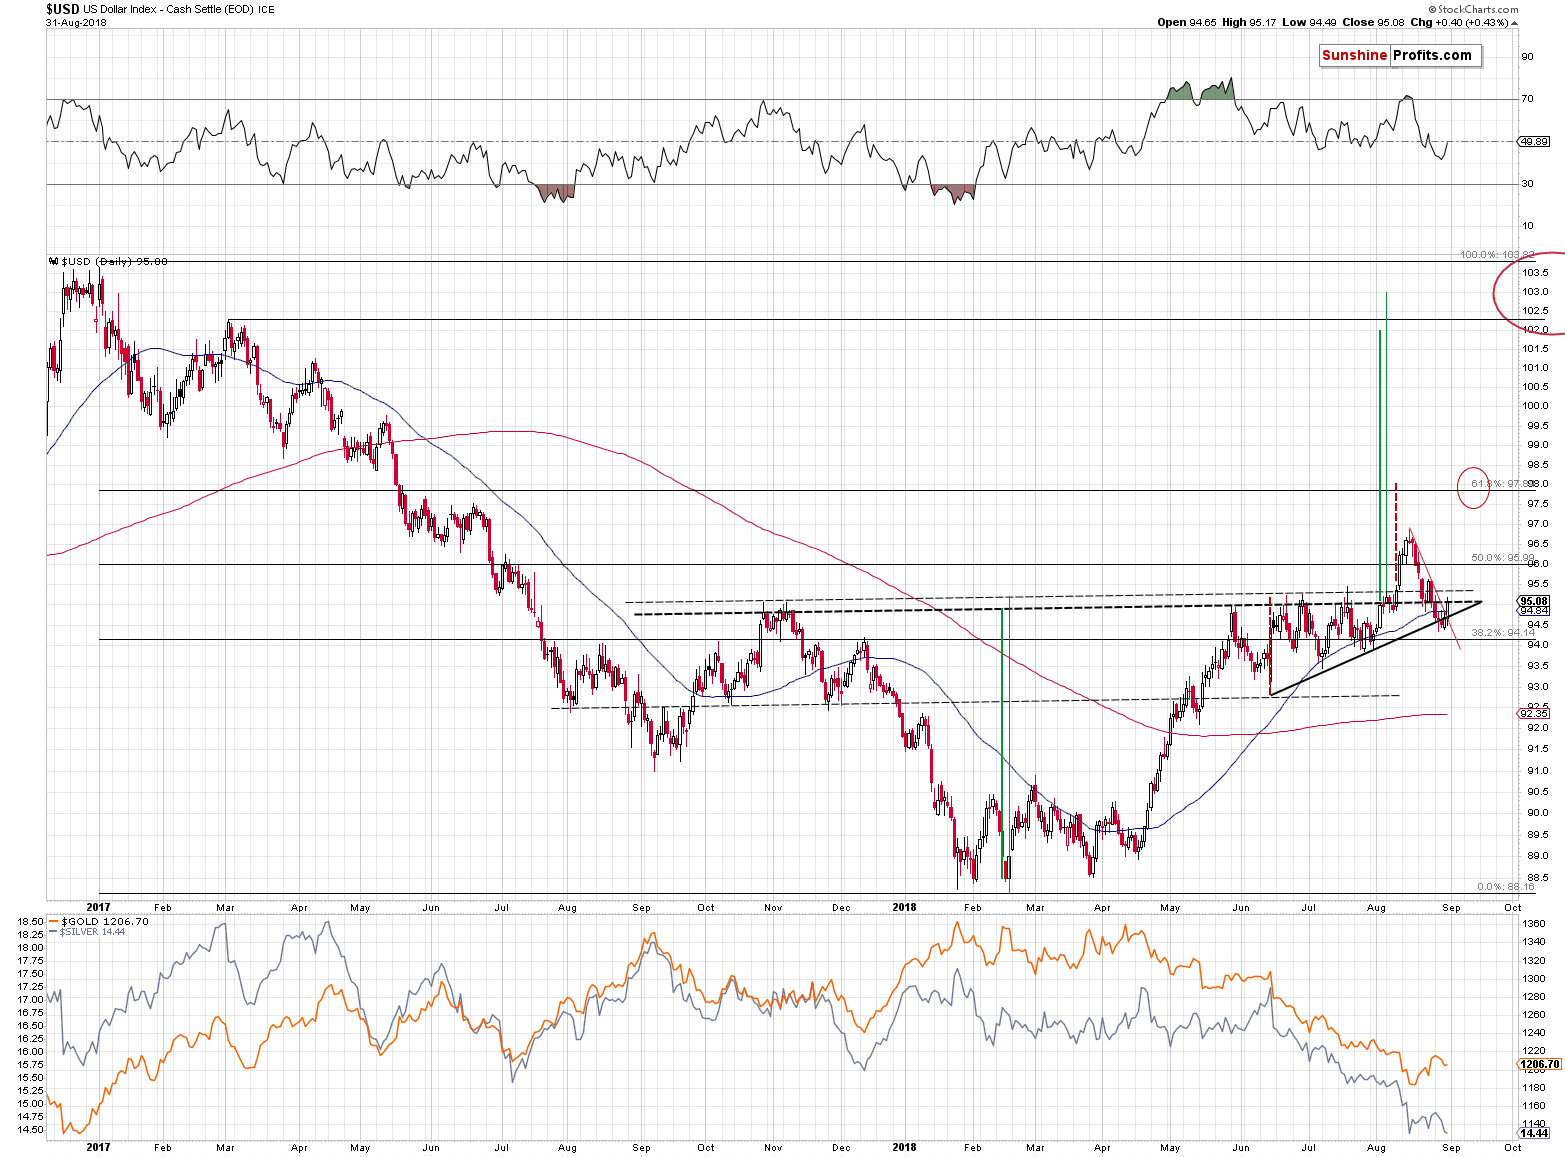
The objective fact is that the USD Index closed the week above 95, so from the weekly point of view there was no decline. Despite the early decline, overall, the USDX moved higher by 0.02 last week. And it never really invalidated the breakout above the neck level of the reverse head-and-shoulders pattern.
Moreover, from the very short-term point of view, we just saw a breakout above the declining red resistance line and the USD rally continues in today’s pre-market trading (95.55 at the moment of writing these words). The outlook for the USD Index remains very bullish, not only from the long-term point of view, but also due to medium- and short-term signals.
Before moving further, we would like to briefly discuss one thing that is often misunderstood when discussing the outlook for the USD Index. It is often said that the USD Index can’t rally, because of all the problems in the US economy, the ballooning debt, etc. The problems are real, but they – alone – are not enough for the USD to either rally or decline.
What?! You’re saying that the key fundamental information is irrelevant?!
No. That’s not what we are saying. We are saying that the USD Index is… and index. Precisely, it’s an average of the currency exchange rates. The EUR/USD exchange rate
has the biggest (over 50%) weight in the index and the USD/JPY exchange rate has the second biggest weight. This means that for the USD Index to rally, the dollar doesn’t have to be perfect. It just has to be a better option than the euro and the yen.
There is a saying that the currencies do not float, but sink at different rates (called inflation). If the non-USD currencies sink faster, the exchange rate mechanisms will cause the USD Index to rally.
The analysts that take a big magnifying glass when discussing what’s wrong with the U.S. economy, but that at the same time entirely ignore the situation in Europe and Japan are entirely missing the point. The situation in the U.S. can be very bad, the debt could be astronomical, but if the situation is even worse in the other major economies (especially in the EU and in Japan), the USD Index is still likely to rally.
So, the next time someone tells you how bad the outlook for the USD Index is, don’t ask them why they think the situation in the US economy is bad. Ask them why they think things are so much better for the EU and Japan. Getting “huh?” as a reply is a good indication that you might want to consider different sources of information.
Having said that, let’s move to the charts and their implications for the following days and weeks.
Gold’s Flag Is Over
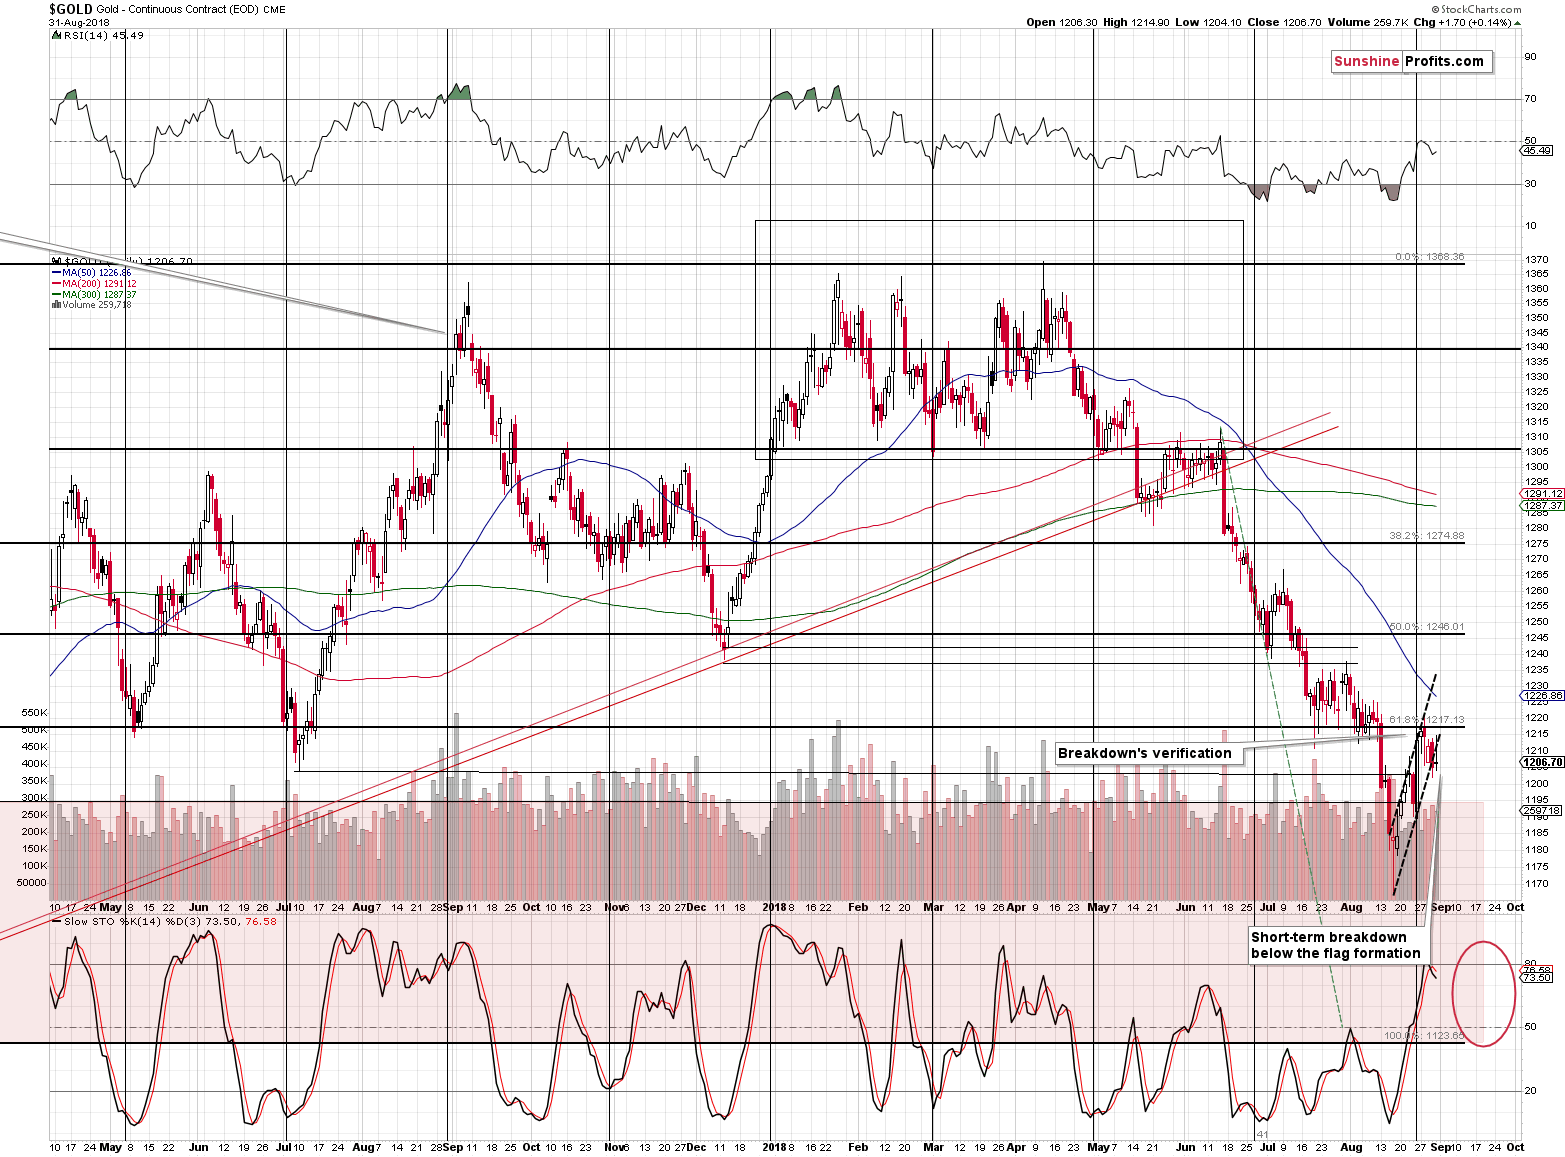
At the moment of writing these words, the price of gold is trading at $1,195, which is well below the flag pattern. This is a strong signal that the correction is over, and that gold is now ready to slide much lower.
The moves that follow the flag patterns tend to be similar in size to the moves that preceded them. Gold declined by about 14.6% (April top – August bottom) before the pattern, so if it declines in a similar way (counting from the late August top), we’re likely to see gold at $1,221 * (1 – 14.6%) = $1,043.73 relatively soon. In other words, based on the recent flag pattern, gold is likely to slide to the December 2015 bottom. And our subscribers – have been prepared for this eventuality for more than a month.
If you think the above is bearish, just wait until we tell you what just happened in silver.
Silver’s Breakdown
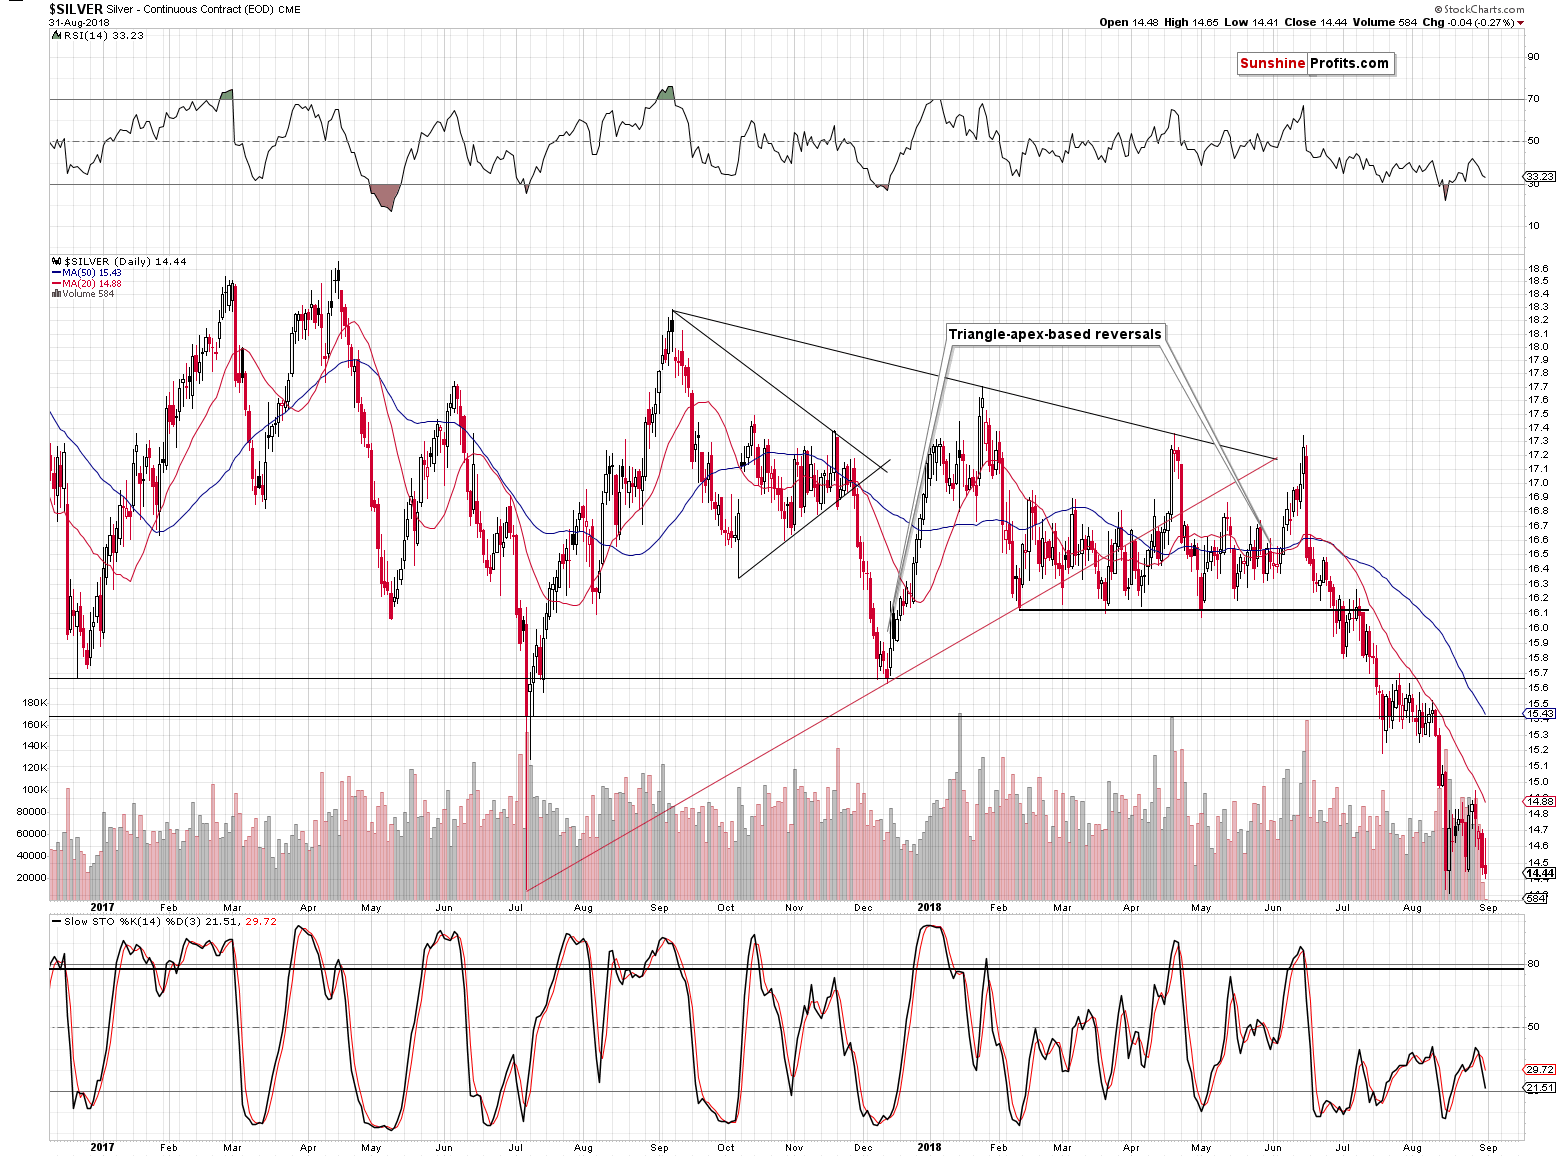
At the end of August, silver closed the session at a new low in terms of daily and weekly closing prices. That’s an unconfirmed, but still major, breakdown. As an unconfirmed move, it wouldn’t have been so important, if it wasn’t for a different fact.
The thing is that the entire late-August consolidation was a pause that followed the breakdown below the rising red support line. So, the unconfirmed move is a part of a different move, in which the decline is already more than confirmed.
The implications are very bearish, especially that silver’s 2015 bottom is not far away and the gold to silver ratio is on the rise (the real long-term resistance is at about 100, not 80-85). This means that if gold is to move much lower shortly, then silver is very likely to slide below the 2015 lows. To be clear, we expect the same for gold, but we think that in the case of silver, the decline will be even bigger and more profound.
At the moment of writing these words, we have silver futures at $14.30, which means that the white metal already moved to new intraday lows of this year.
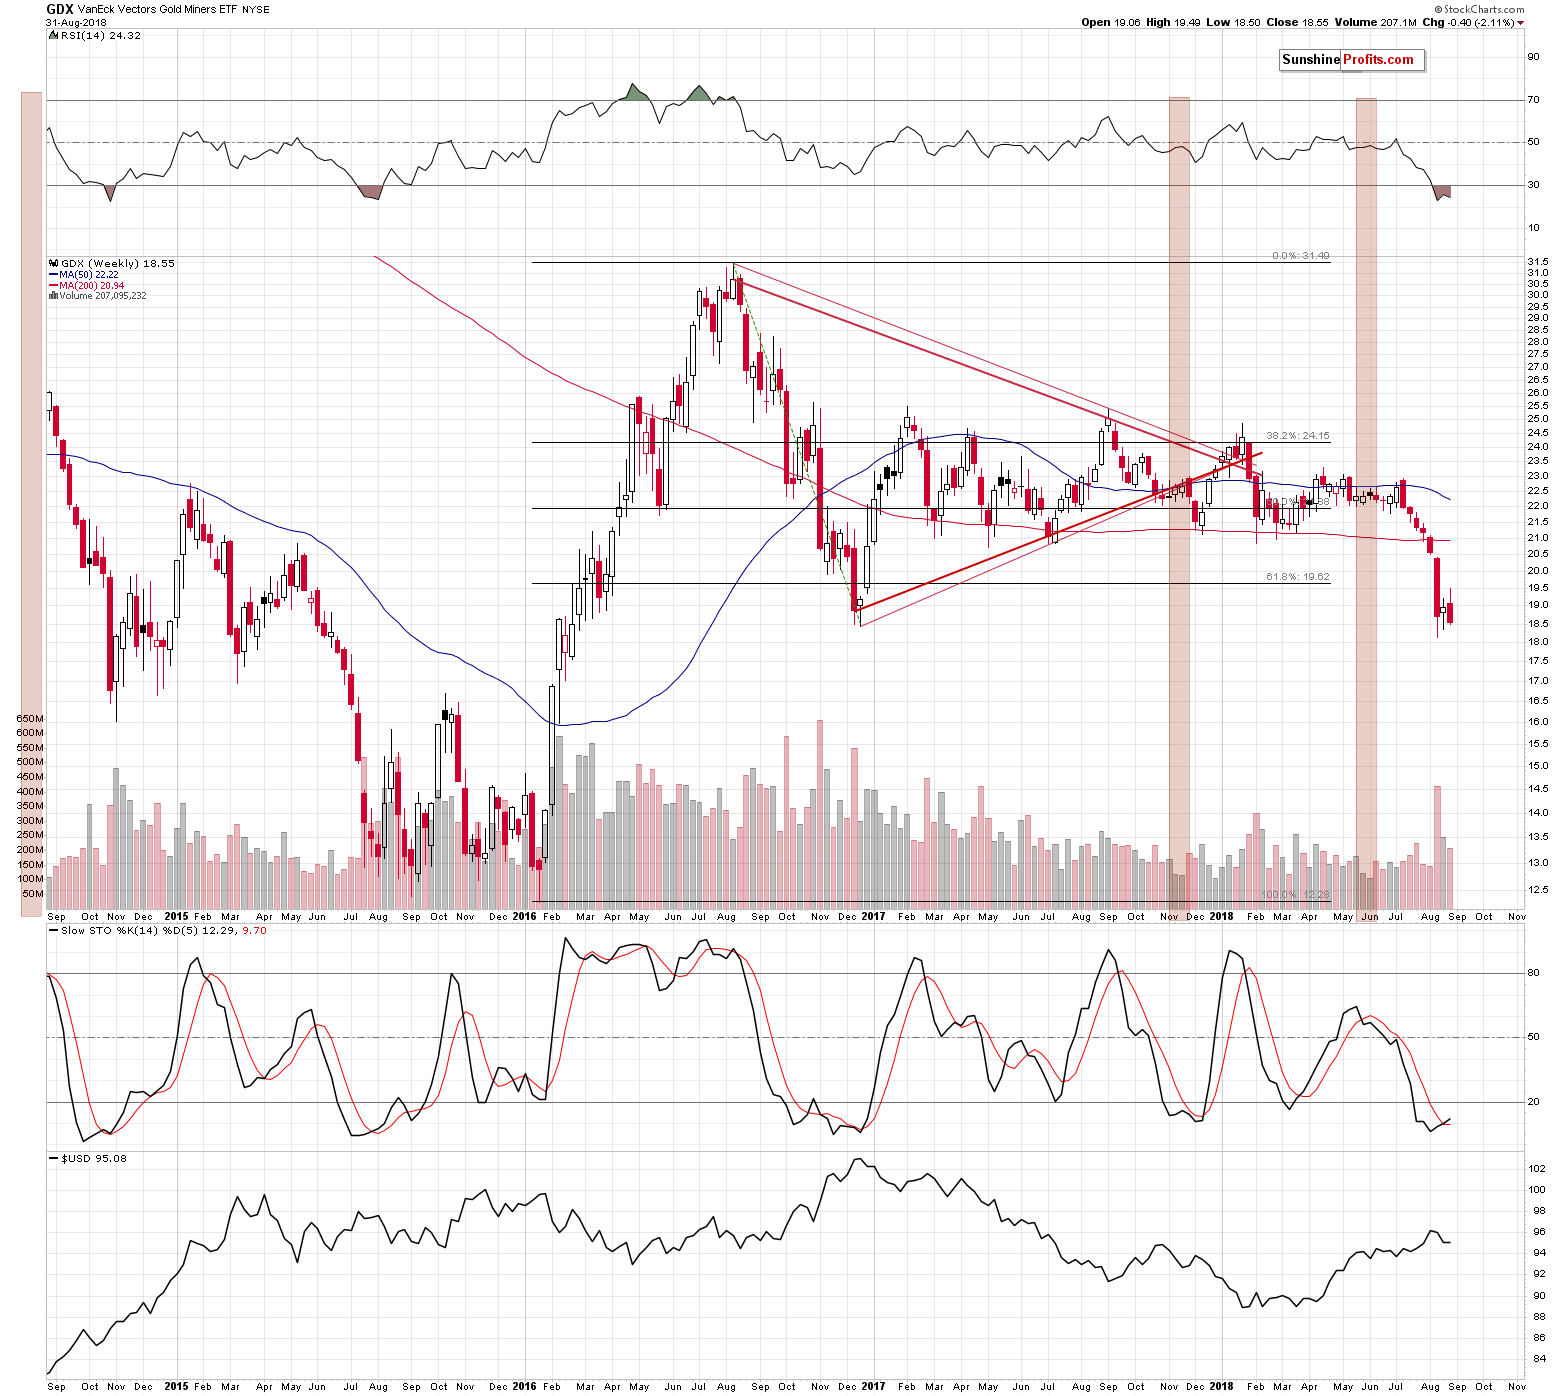
Miners’ Breakdown

Last week, the GDX ETF, a proxy for the mining stocks sector, closed below the previous 2018 weekly closing prices. In other words, we just saw a breakdown in terms of the weekly closing prices.
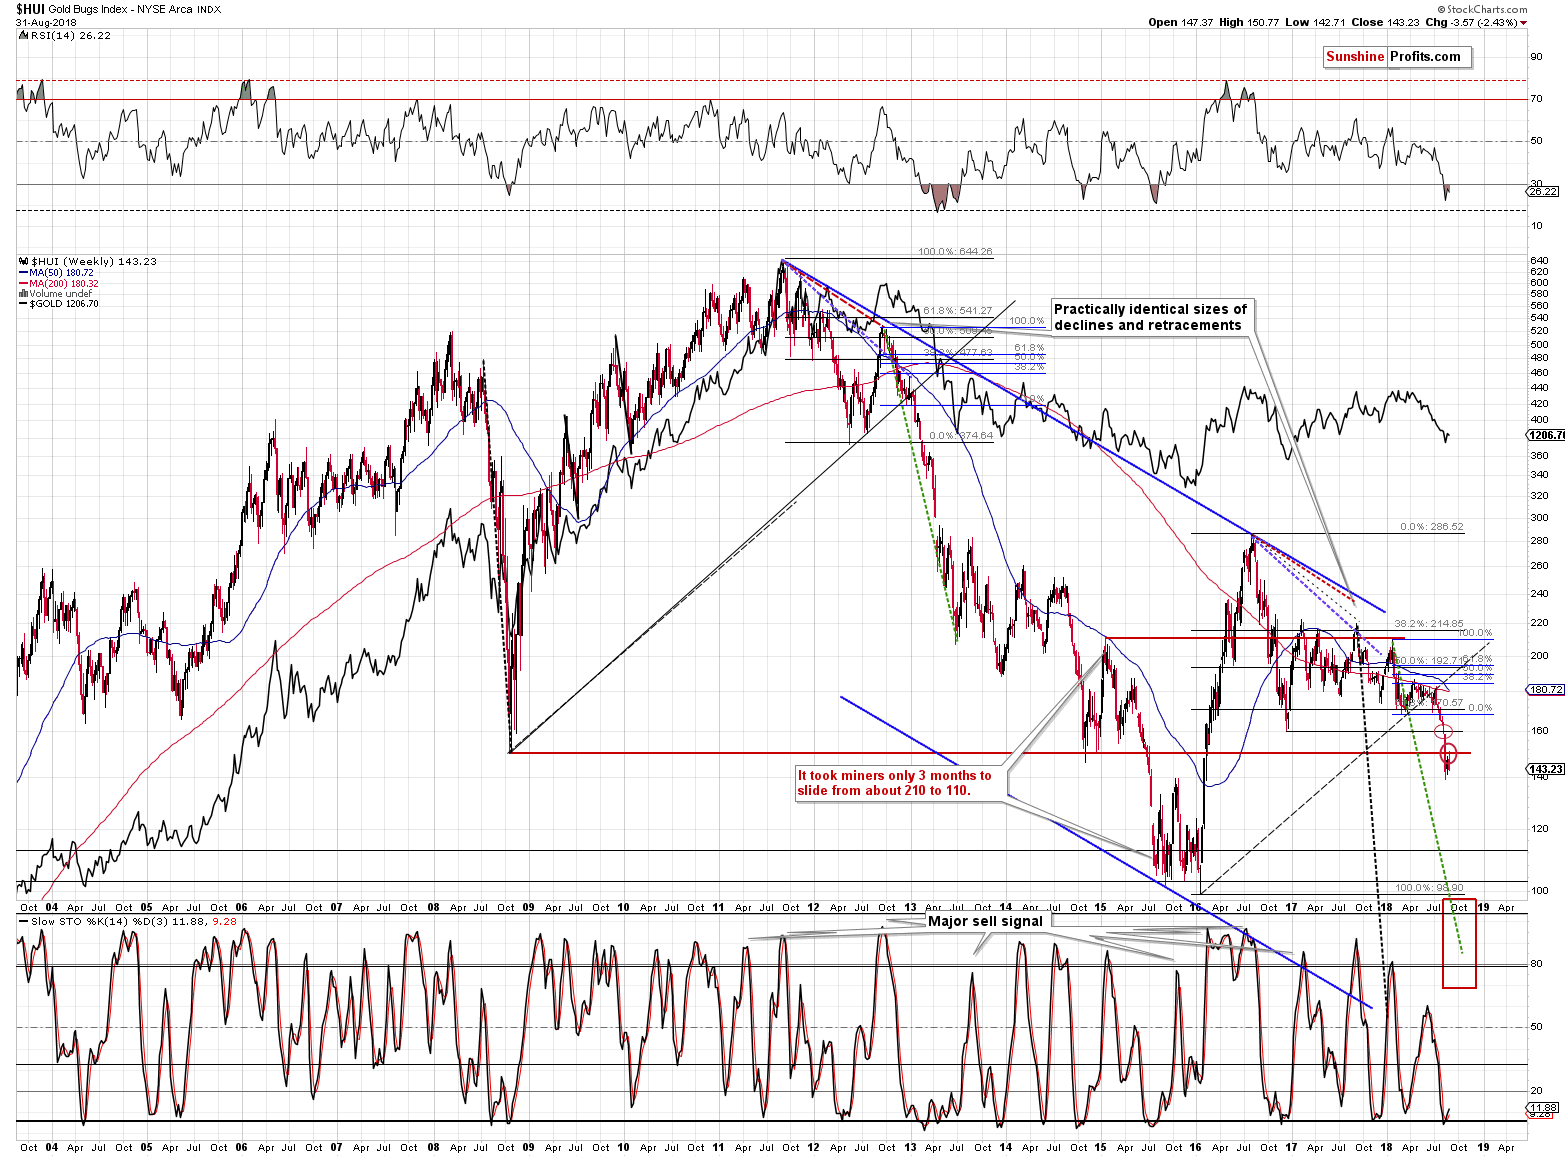
The HUI Index, an even more important proxy for mining stocks, moved a bit higher after breaking below the 2008 and late 2014 lows and then it declined once again. The breakdowns were verified. The decline can now continue.
The decline is likely to be big and sharp as there is no significant support all the way down to the 2015 and 2016 lows. That’s a big slide. And it may not end there. In fact, miners are likely to move to new lows just like gold and silver are. It’s not apparent how low they will slide, but it is likely that this becomes clearer once the entire sector moves lower. We’ll keep our subscribers informed via daily and intraday Alerts.
Finally, we would like to address the question that we’ve been asked multiple times recently. The SP Silver-Miner Indicator that we described in our Buy-and-hold on Steroids essay is not yet available for public viewing. We have it to use in our Excel spreadsheets, but we are not yet prepared to provide it on our website (it needs a few technical adjustments). But, please note that the first time when it’s really useful will be after the final bottom as THE bottom is likely to be immediately followed by mining stocks outperformance. The SP Silver-Miner Indicator will become exceptionally useful after that time, as it will help to detect the optimal moment for making the switch from miners to silver (at least in the case of a part of one’s portfolio).
Summary
Summing up, it’s very likely that the pause in the precious metals market is over and the next big move down is already underway. The move is likely to be sharp and the profits on the current short positions are likely to change from being huge to being enormous and then finally to being ridiculous. You might consider taking advantage of this move as well.
Want free follow-ups to the above article and details not available to 99%+ investors? Sign up to our free newsletter today!
Author

Przemyslaw Radomski, CFA
Sunshine Profits
Przemyslaw Radomski, CFA (PR) is a precious metals investor and analyst who takes advantage of the emotionality on the markets, and invites you to do the same. His company, Sunshine Profits, publishes analytical software that any


