Gold and Silver bearish engulfing candles form

Gold
-
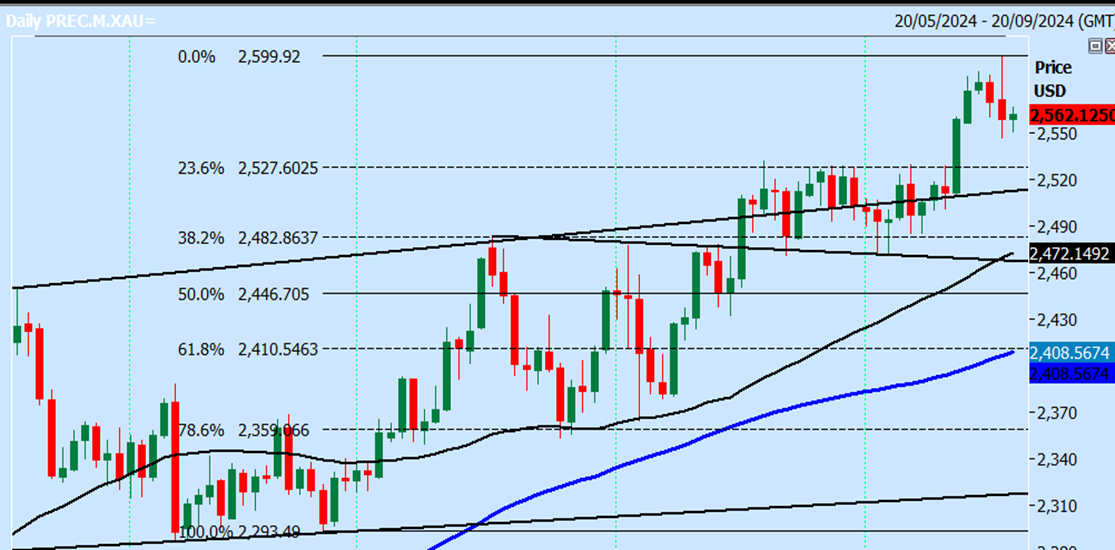
Gold I expected further gains this week to 2599/2602 & this next target was hit yesterday on the 0.5% rate cut. In fact we made a new all time high exactly here at 2599.
-
However prices then immediately collapsed to 2546 leaving a bull trap & bearish engulfing candle on the daily chart in overbought conditions. This is the danger of trading big news events of course.
-
I am not going to take this as a sell signal just yet, but it is a warning to bulls & could see us unfortunately trade in yet another a sideways consolidation in the coming days, possibly weeks. We are getting used to these sideways pattern recently in Gold.
-
If we do make a break above 2604 we should target 2620/22 but this is looking unlikely at this stage.
-
For now I will still be a buyer on further weakness (& it is likely we will see further profit taking to the downside).
-
We could fall as far as the previous all time high at 2531/2526 where I would try longs with stop below 2521.
Silver
-
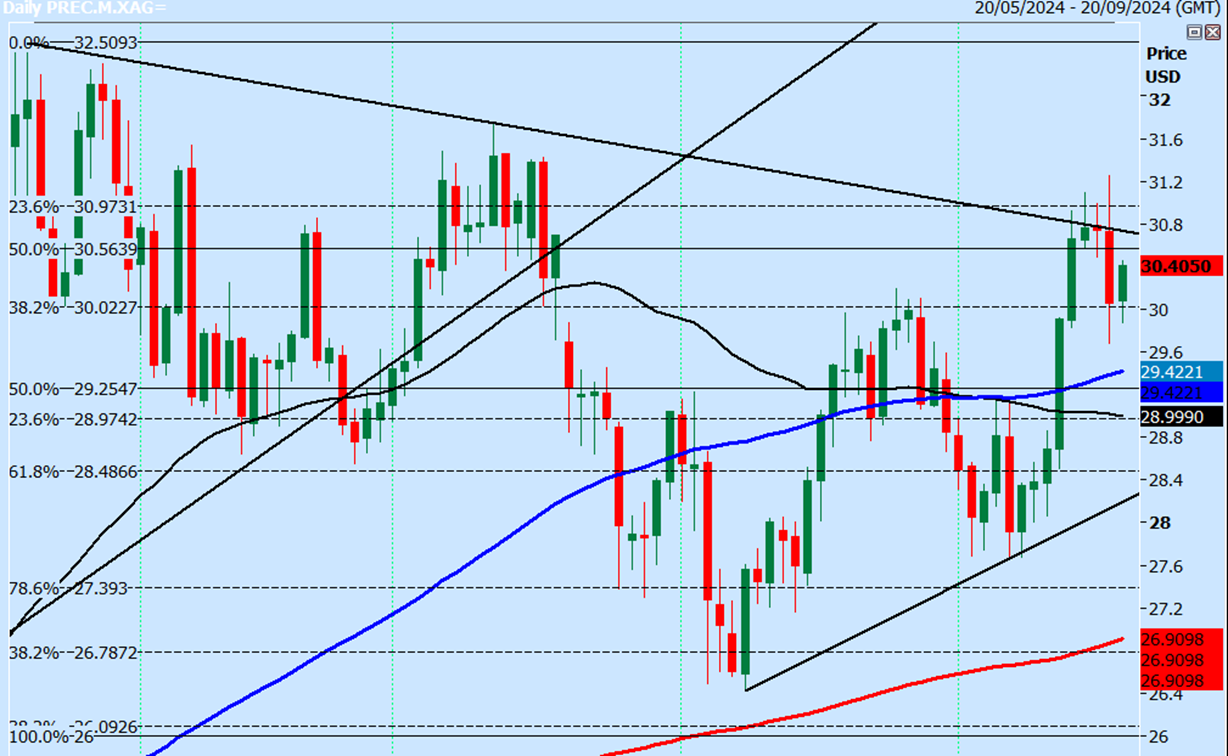
Silver reached 3125 but then unexpectedly crashed to 2968, leaving a huge bearish engulfing candle that wiped out the price gains of the last 3 sessions. This is an important bull trap in overbought conditions.
-
If you tried a long at support at 3010/2990 & managed to hold on in the volatile conditions we are headed towards the 1st target of 3040 & could even reach 3070. However gains are likely to be limited with bulls unexpectedly caught out yesterday.
-
It looks like we can continue lower in to the end of the week eventually & target support at 2945/35. Longs need stops below 2920.
-
If this trade fails we are stuck in the longer term sideways trend & we will find it difficult to identify low risk trades.

WTI Crude October future
Last session low & high for the October contract: 6973 - 7148.
(To compare the spread with the contract that you trade).
-
WTI Crude we wrote: could be edging higher, back to the break point of the longer term 18 month trend line at 7110/50...I hope to sell at 7110/50 & stop above 7200.
-
This trade was been triggered as hoped, with a high for the day exactly the resistance yesterday, before we hit the 1st target of 6990. I think there is a good chance we continue lower towards 6890, perhaps as far as 6790 in to the end of the week. It may also be worth selling on a break below 6840 to target 6800, 6730/20 & perhaps as far as 6660.
-
Try longs at 6550/6500 if we get a chance today with stops below 6400. Targets: 6690/6720, 6800/6820, perhaps as far as 6870/6900.
-
A break below 6400 signal further losses which could be as far as the 500 week moving average at 6200.
Author

Jason Sen
DayTradeIdeas.co.uk


