Global markets at a crossroads: Bond yields, US Dollar struggles, and Gold's supercycle signal major shift

As US–China tariff tensions heat up, the fallout is spreading across bonds, currencies, stocks, and commodities—revealing a broad shift in market sentiment that could redefine the next cycle.
Macro and technical deep dive across asset classes
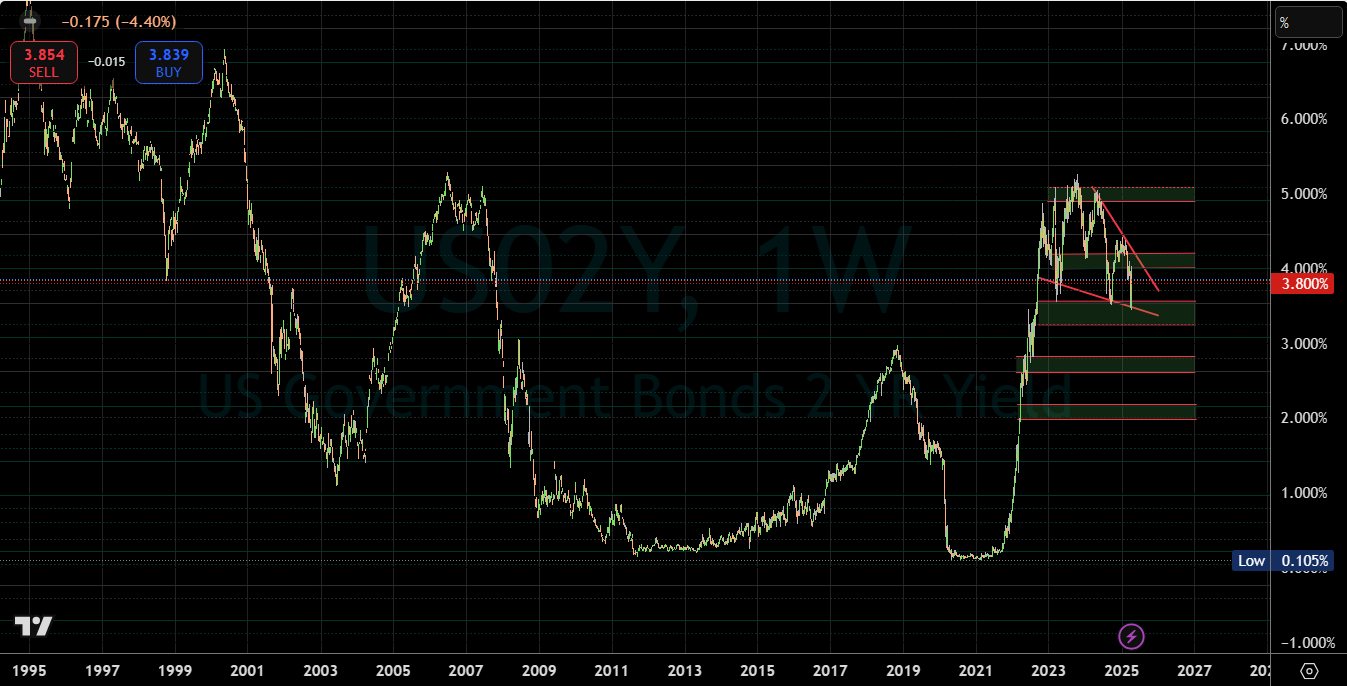
2-year US Treasury yield: The market's immediate sentiment gauge
The 2-year yield currently trades at 3.805%, unfolding within a well-defined three-year falling wedge pattern. This formation follows an extraordinary surge from 0.105% in January 2021 to 5.283% in October 2023—reflecting rapid Fed rate hikes and inflation expectations. The 4.00% level, which aligns with the Fibonacci 23.6% retracement, has been tested multiple times, indicating it as the immediate battlefield for bulls and bears.
Warning signs: If yields fail to stay above 4.00%, a decline toward 3.54% and 3.25% becomes probable, with further downside risk to 2.80%, 2.62%, 2.34%, and potentially 2.16%. A drop this deep would imply markets are aggressively pricing in future rate cuts or recession fears.
Breakout scenario: A decisive break above 4.00% would violate the falling wedge ceiling, targeting 4.17% and 4.46% and possibly retesting the 5.00% highs. This would indicate renewed fears of sticky inflation or delayed Fed easing.
Fundamental reflection: The 2-year is the cleanest read on front-end Fed policy sentiment. Its sensitivity to Fed language, inflation trends, and geopolitical disruption (e.g., tariffs) means its technical posture is deeply rooted in macroeconomic fragility.
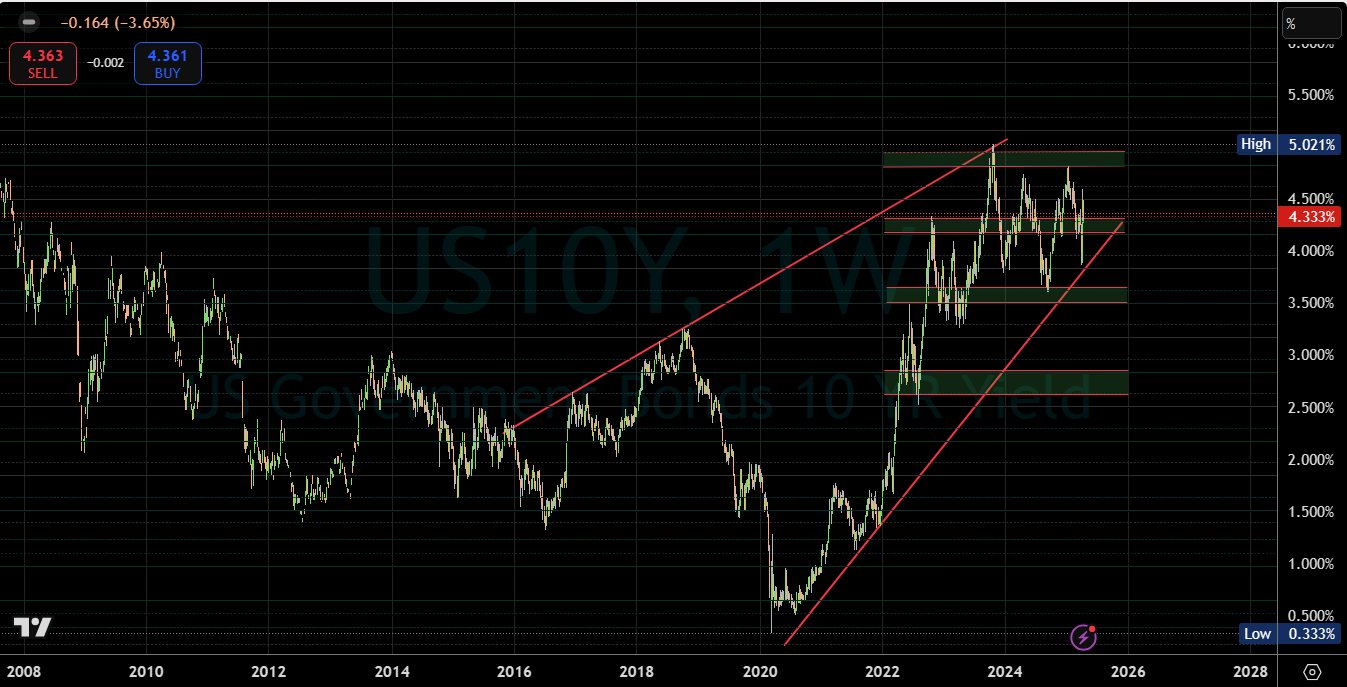
10-year US Treasury yield: The growth vs. inflation battleground
The 10-year yield is contained within a decade-long rising wedge pattern, a structure known to resolve into trend reversals. Since the pandemic low of 0.333% in March 2020, yields climbed to 5.00% in October 2023, marking a historic bear market in bonds. The current level near 4.20% is significant—it's a Fib confluence zone (23.6%) and a retest of the March 2025 breakout area.
Support watch: If yields fall below 3.95% and 3.82%, a move to 3.30%, 3.16%, 2.85%, and 2.63% could signal disinflation or economic contraction.
Upside risk: A breakout above 4.28% could signal market acceptance of persistent inflation. Targets include 4.50%, 4.61%, 4.82%, and 4.94%.
Fundamental insight: This yield captures long-term optimism vs. scepticism. A flattening or inversion relative to the 2-year could signal economic pessimism or Fed policy errors.
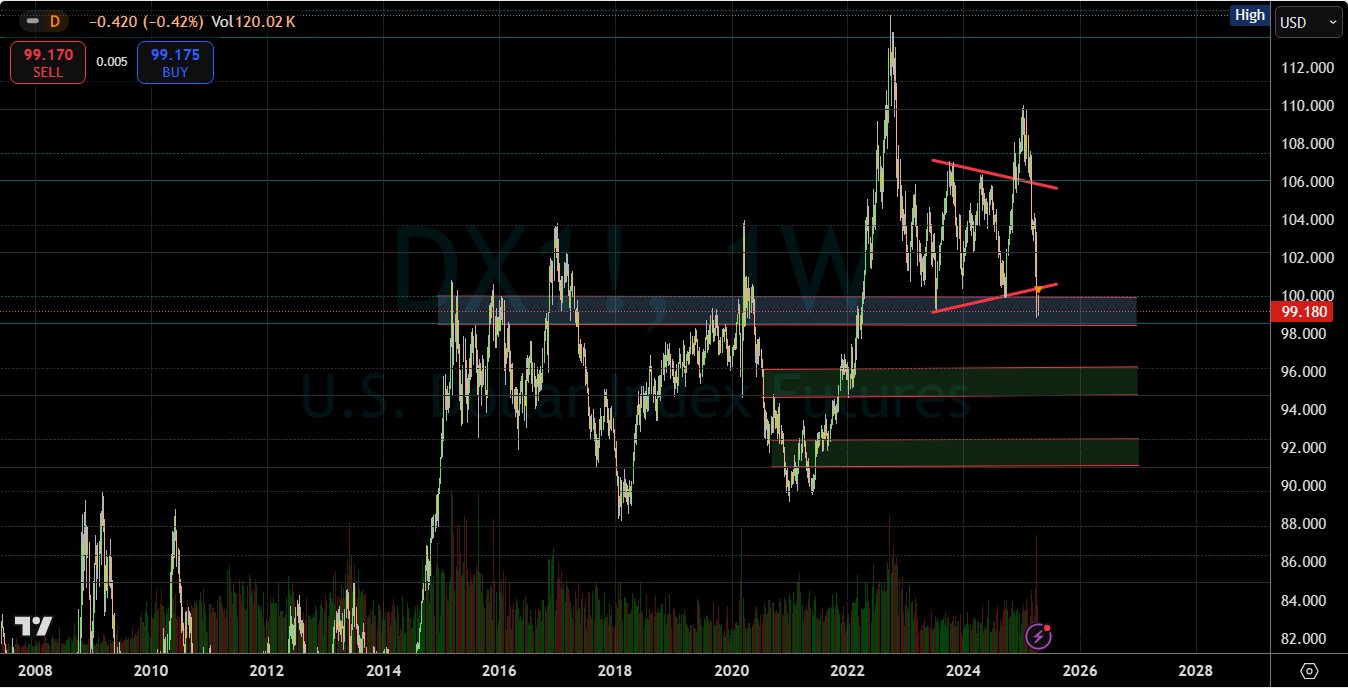
US Dollar Index: Confidence on the brink
The DXY hovers at a decade-defining level, struggling to reclaim the 100 zone. It trades in the midpoint of a 10-year price cycle and looks vulnerable, especially under macro pressure from a weakening yield curve, trade war escalation, and deteriorating global sentiment toward US assets.
Bearish continuation: A break below 98-52 would accelerate a move toward 96.20, 94.76, and potentially 92.44. These levels align with prior recessionary periods.
Recovery potential: A push through 100 opens the door for 102.28, but that remains unlikely without a yield rally, or risk-off flows favoring USD.
Macro considerations: The US administration's renewed tariff assault on China and other nations has reduced the appeal of the USD as a global safe haven. Capital flight into gold and yen signals a shift in reserve preference.
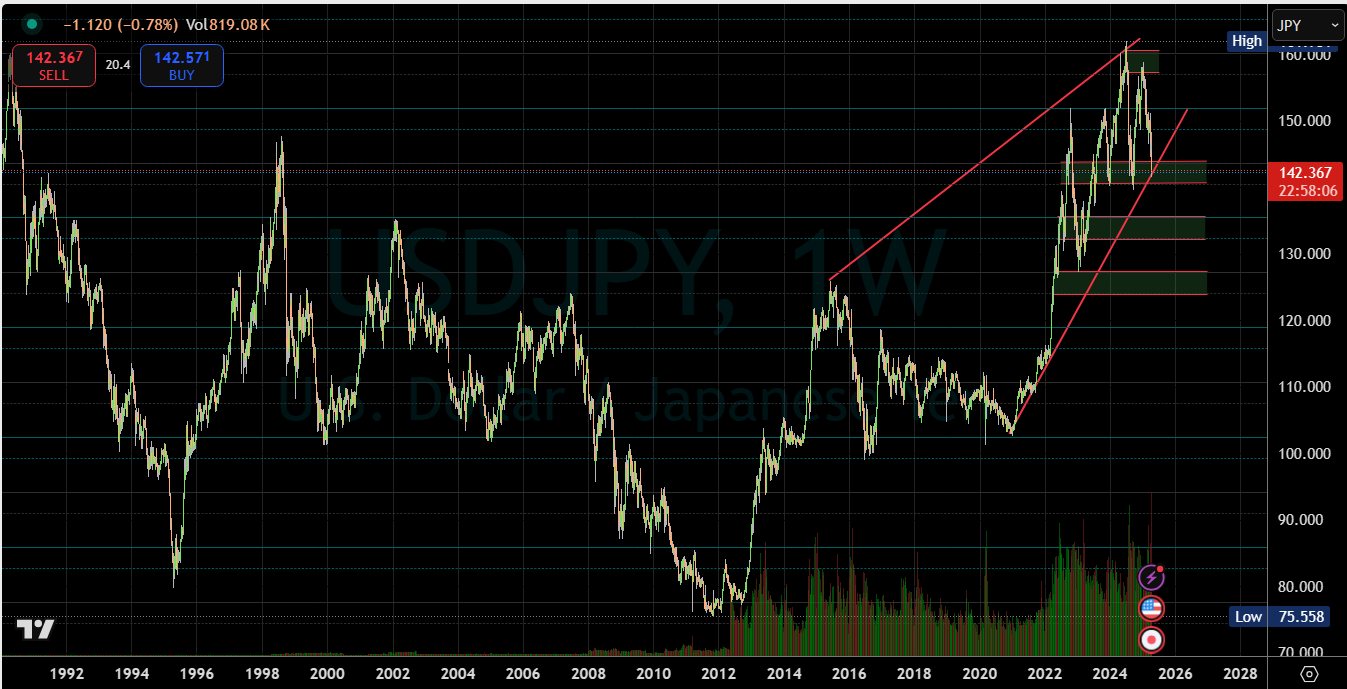
USD/JPY: A reversal of a 10-year trend
USD/JPY is down nearly 10% from its January 2025 highs at 157, now trading just above the 140 threshold. The currency pair is testing the base of a 10-year rising wedge, and its recent failure to reclaim support at 148.83 is concerning.
Structural breakdown: If 140 is lost, the potential downside opens to 135, 132, and 127. The last time this pair broke similar structural levels was in 2016–2017, during a major dollar correction.
Macro pressure: A hawkish BoJ and collapsing US yields are reversing the carry trade. Demand for the yen as a haven asset is rising amid volatility and equity losses.
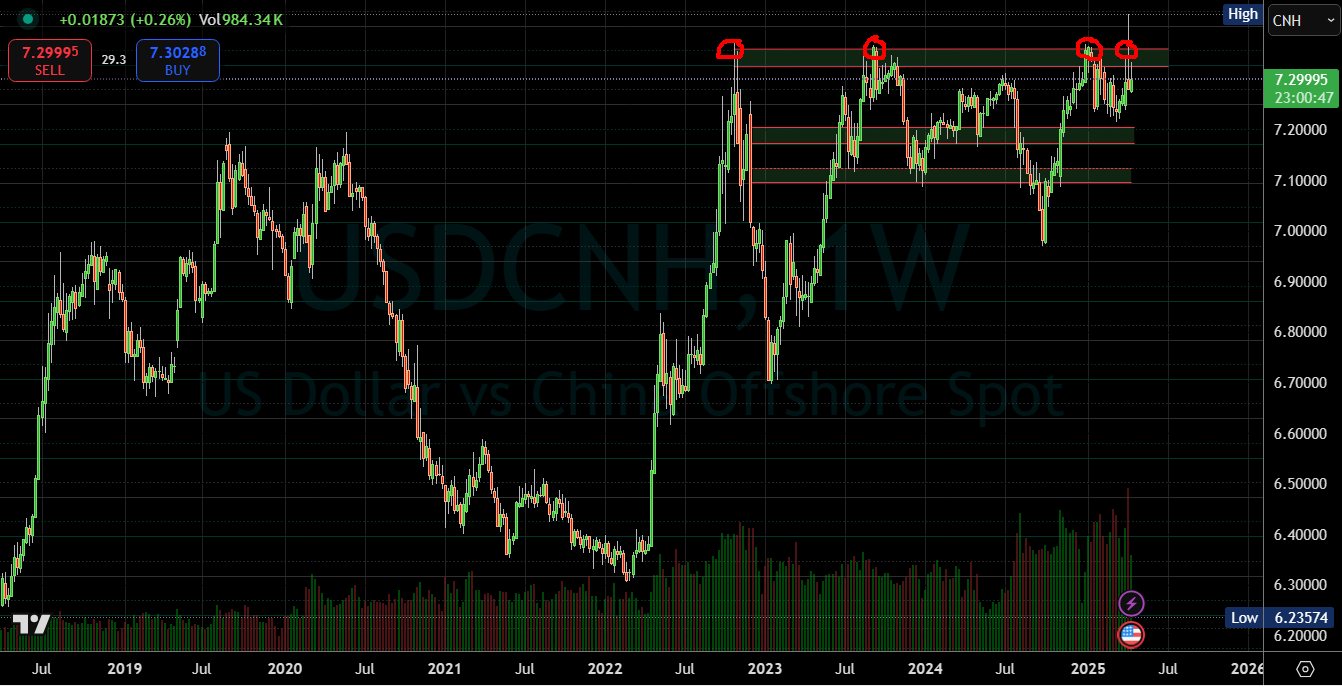
USD/CNH: The trade war pressure point
USD/CNH is at the centre of the tariff war. A three-year resistance zone near 7-35/7-32 has failed once again. This repeated failure shows strategic resistance by Chinese policymakers or macro selling pressure.
Support levels: 7-27 and 7-25 must hold. A drop through these levels could spark a move to 7-20 and 7.17.
Geopolitical lens: China may begin allowing yuan appreciation to avoid excessive inflation from import tariffs. This could shock the USD/CNH lower and stoke global de-dollarization narratives.
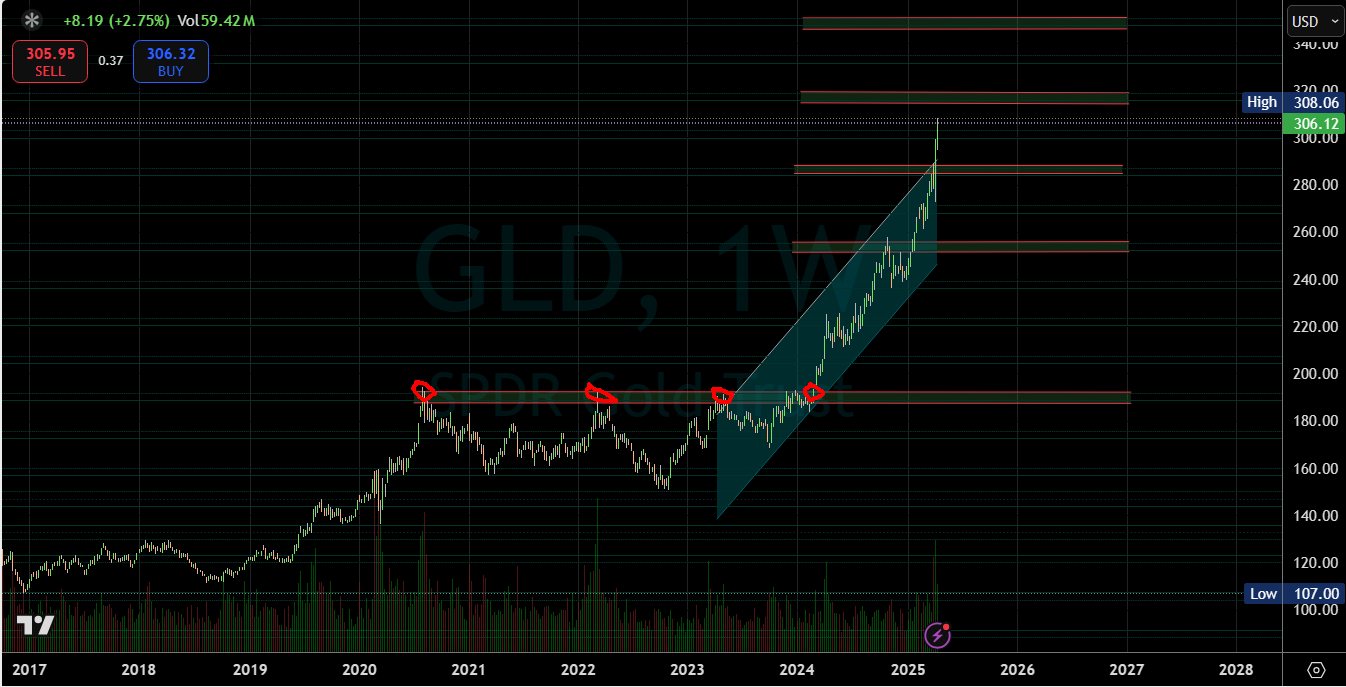
Gold ETF (GLD): Volume-powered breakout
GLD has gained 60% since breaking out at 191.65 in March 2024. It now aims for 318.85, with a longer-term target of 350.65 if the macro backdrop continues to deteriorate.
Demand drivers: Safe haven flows, central bank accumulation, and the loss of confidence in USD-backed bonds. Volume confirms conviction buying.
Strategic implication: GLD is confirming the broader shift out of fiat and into hard assets. Investors expect instability to persist.
XAU/USD: Supercycle in motion
Gold has broken out of a two-year bullish channel and completed its fifth price cycle in the golden supercycle structure. Current supports are at 3290, 3256, and 3230. Targets are 3620 and 3650.
Why it matters: This move is not speculative; it's institutional rotation. Gold is reclaiming its role as the anchor of stability in a chaotic macro world.
Macro drivers: Tariff escalation, currency devaluation, and central bank gold buying (notably by China, Russia, and India).
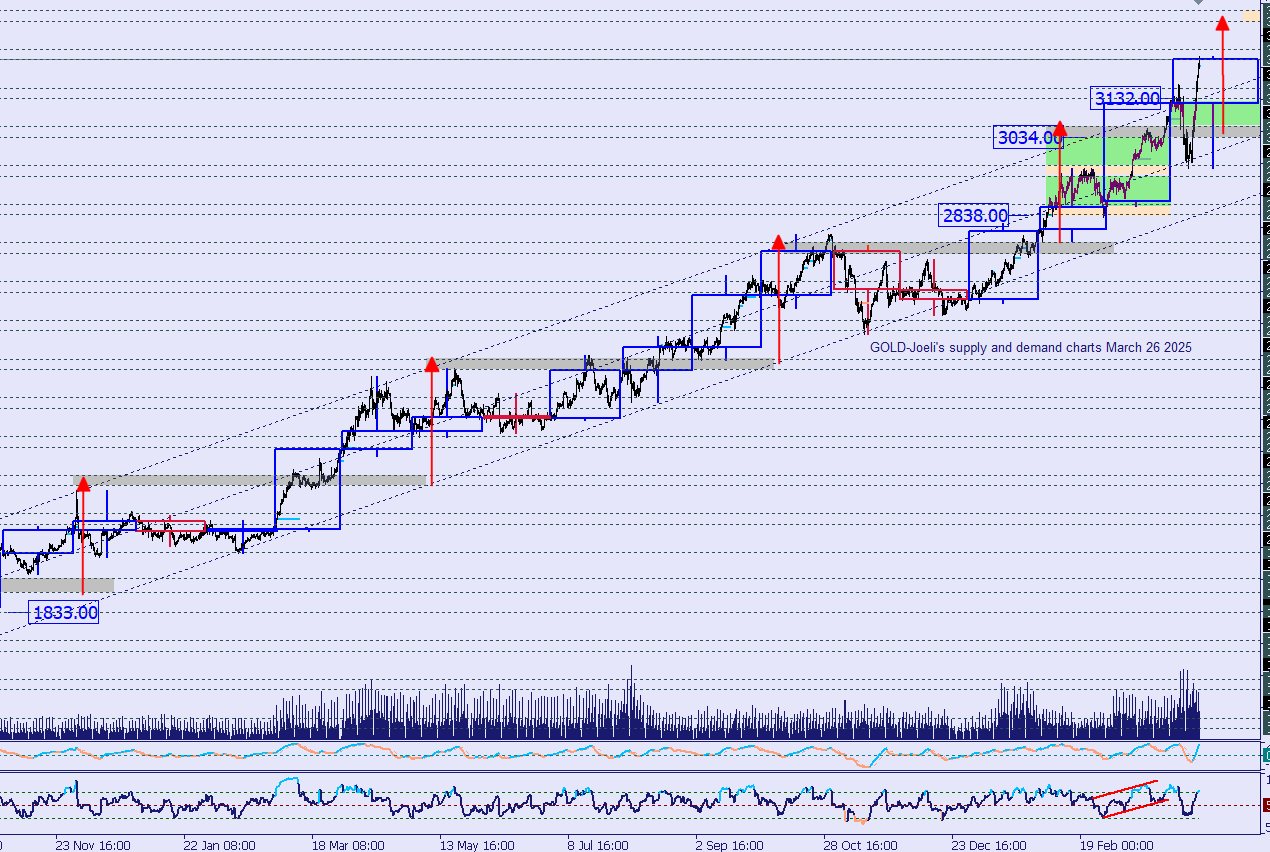
Gold March 2025 analysis
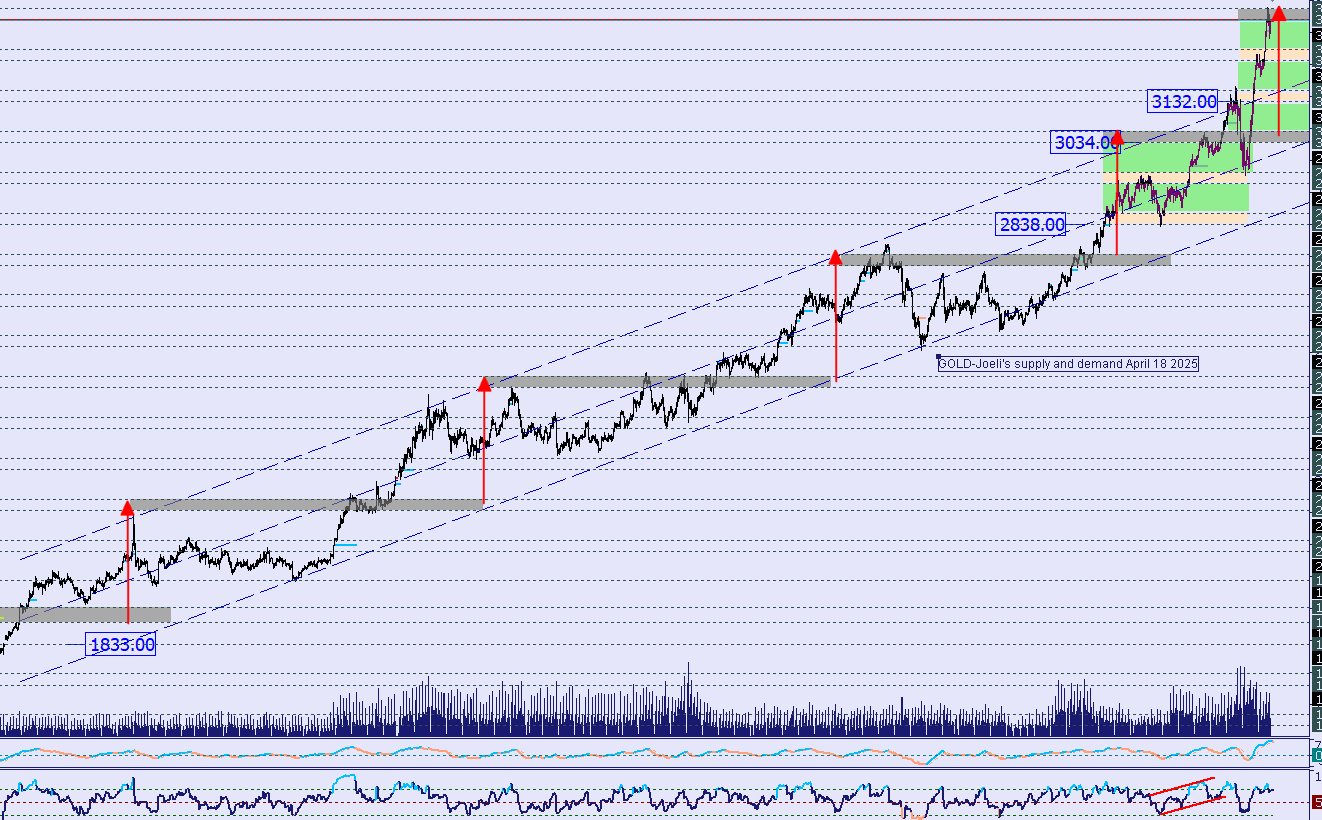
Gold April 18 2025 analysis
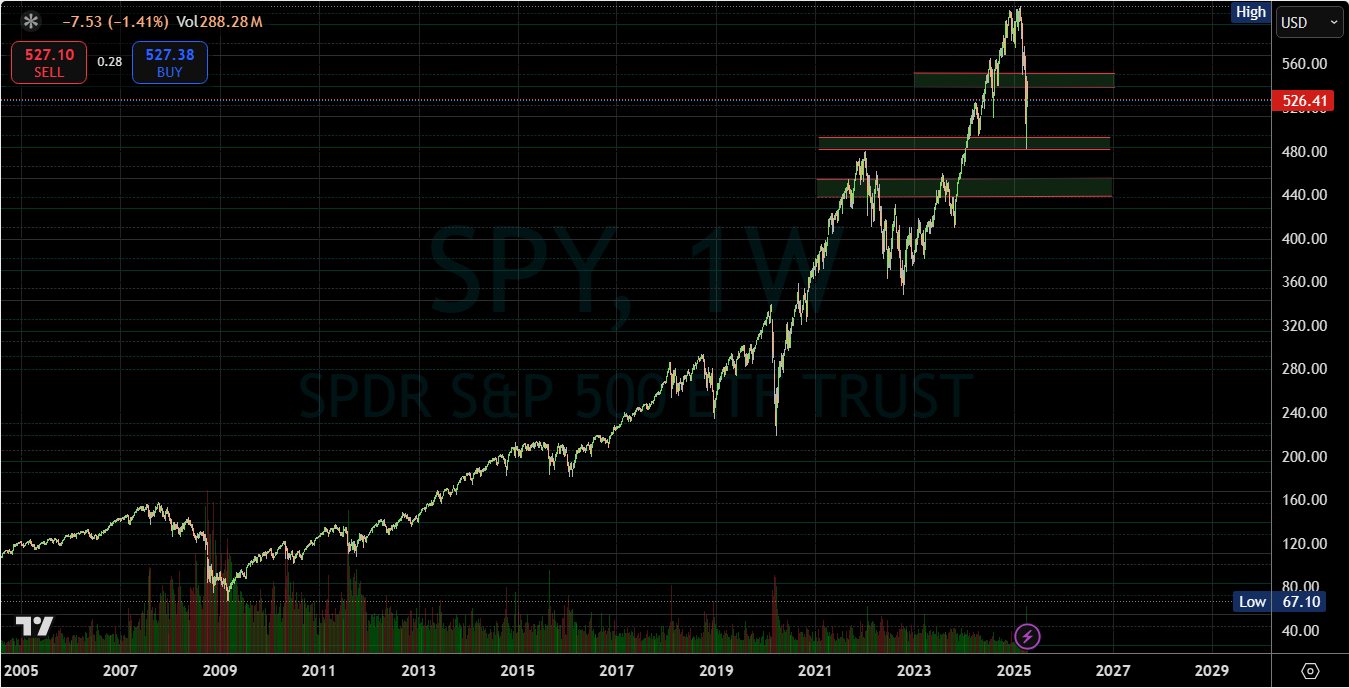
SPY: Rebound rejected
SPY rebounded from 484 to retest the 550 level, only to fail and resume a downward trend. Current downside targets are 522, 511, then 494, 455, and 438.
Technical breakdown: Lower highs and failed resistance reclaim = classic downtrend confirmation.
Investor insight: Traders are shifting from growth to defensives. Tariff-induced margin pressure is squeezing earnings.
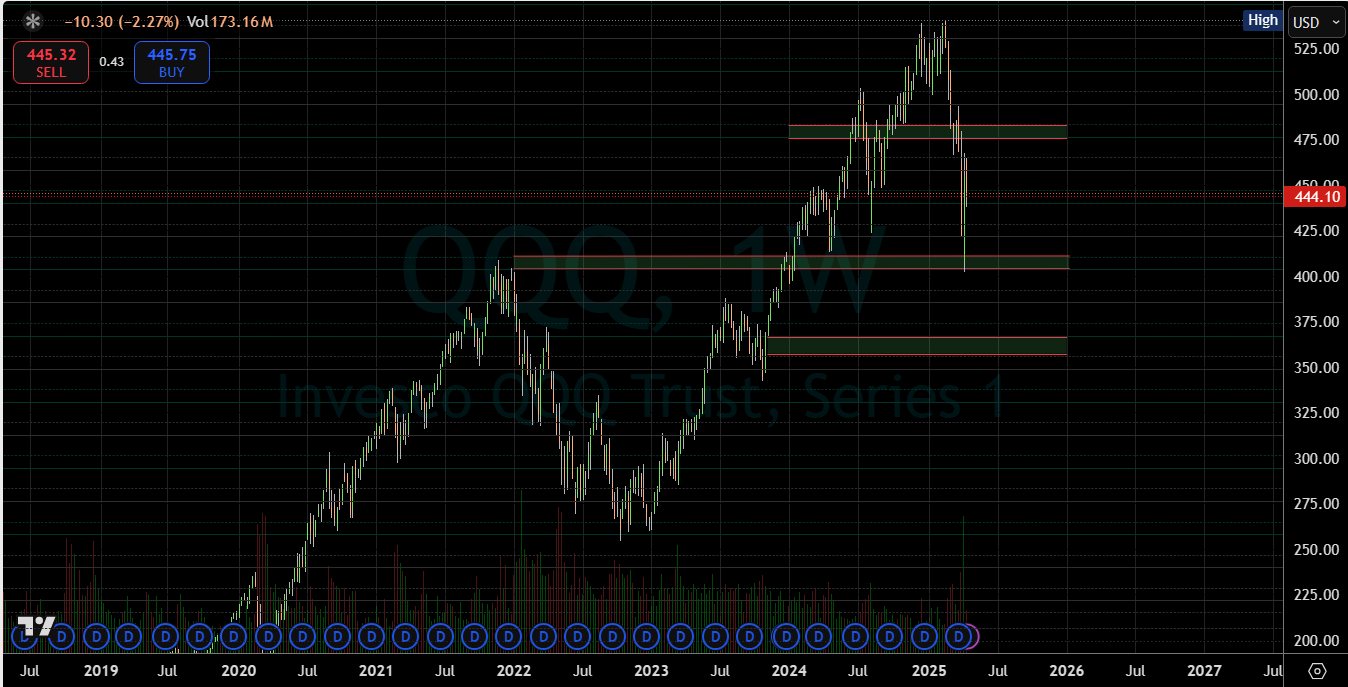
QQQ: Tech cracks forming
QQQ's rebound peaked at 465, failing to reach key resistance at 476. Support lies at 440, 428, 421, 410, 404, and deeper zones at 367 and 356.
Context: Tech stocks are highly sensitive to rising costs (tariffs) and declining capital flows (falling yields). QQQ is telling us the market is shedding risk.
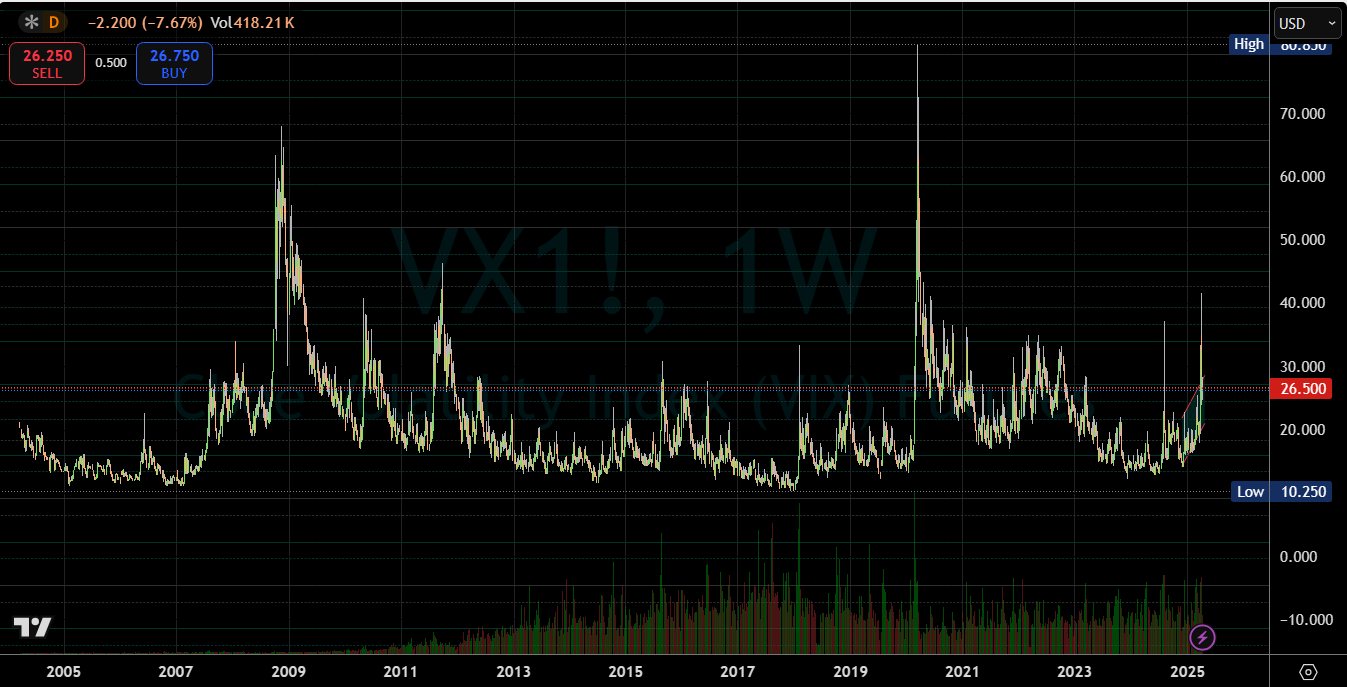
VIX: A silent siren
VIX pulled back from 41-50 to hold at 24-50 and now trades near 27. A breakout above 27 targets 34 and 36.60.
Market message: The fear gauge is no longer receding after spikes—it's forming higher lows. Expecting more volatility is not paranoia; it's preparation.
Strategic warning: A rising VIX during falling yields and equities reflects systemic fragility. Watch for liquidity events or credit stress.
Final thoughts
This multi-layered analysis reveals a market undergoing structural change. Bonds hint at policy shifts, currencies at global confidence shifts, and commodities at long-term hedging strategies. The dollar is at risk, gold is rising, and volatility is reawakening. This isn't just a market rotation—it's a change of guard in the global financial order. A regime shift is underway, and it may define the structure and behaviour of markets for years to come.
Author

Denis Joeli Fatiaki
Independent Analyst
Denis Joeli Fatiaki possesses over a decade of extensive experience as a multi-asset trader and Market Strategist.


