![]() Nick Mastrandrea
Nick Mastrandrea
Market Tea Leaves
USD: Sept '24 is Up at 103.000.
Energies: Sept '24 Crude is Down at 79.89.
Financials: The Sept '24 30 Year T-Bond is Down 2 ticks and trading at 123.08.
Indices: The Sept '24 S&P 500 emini ES contract is 37 ticks Higher and trading at 5379.00.
Gold: The Dec'24 Gold contract is trading Down at 2503.00.
Initial conclusion
This is not a correlated market. The USD is Up and Crude is Down which is normal, but the 30 Year T-Bond is trading Down. The Financials should always correlate with the US dollar such that if the dollar is Higher, then the bonds should follow and vice-versa. The S&P is Higher and Crude is trading Lower which is correlated. Gold is trading Lower which is correlated with the US dollar trading Up. I tend to believe that Gold has an inverse relationship with the US Dollar as when the US Dollar is down, Gold tends to rise in value and vice-versa. Think of it as a seesaw, when one is up the other should be down. I point this out to you to make you aware that when we don't have a correlated market, it means something is wrong. As traders you need to be aware of this and proceed with your eyes wide open. Asia traded mainly Higher with the Indian Sensex in negative territory. All of Europe is trading Lower with the exception of the Spanish IBEX exchange at the present time.
Possible challenges to traders
-
NFIB Small Business Index is out at 6 AM EST. This is Major.
-
Core PPI m/m is out at 8:30 AM EST. This is Major.
-
PPI m/m is out at 8:30 AM EST. This is Major.
-
FOMC Member Bostic Speaks at 1:15 PM EST. This is Major.
Traders, please note that we've changed the Bond instrument from the 10 year (ZN) to the 2 year (ZT). They work exactly the same.
We've elected to switch gears a bit and show correlation between the 10-year Treasury notes (ZN) and the S&P futures contract. The YM contract is the Dow Jones Industrial Average, and the purpose is to show reverse correlation between the two instruments. Remember it's likened to a seesaw, when up goes up the other should go down and vice versa.
Yesterday the ZT migrated Higher at around 8:30 AM EST. If you look at the charts below the ZT gave a signal at around 8:30 AM with no real economic news is sight and started its Downward slide. Look at the charts below and you'll see a pattern for both assets. The Dow moved Lower at 8:30 AM and the ZT moved Higher at around the same time. These charts represent the newest version of BarCharts, and I've changed the timeframe to a 15-minute chart to display better. This represented a Long opportunity on the 2-year note, as a trader you could have netted about 40 plus ticks per contract on this trade. Each tick is worth $7.625. Please note: the front month for ZT is Sept and the Dow is now Sept '24. I've changed the format to filled Candlesticks (not hollow) such that it may be more apparent and visible.
Charts courtesy of barcharts
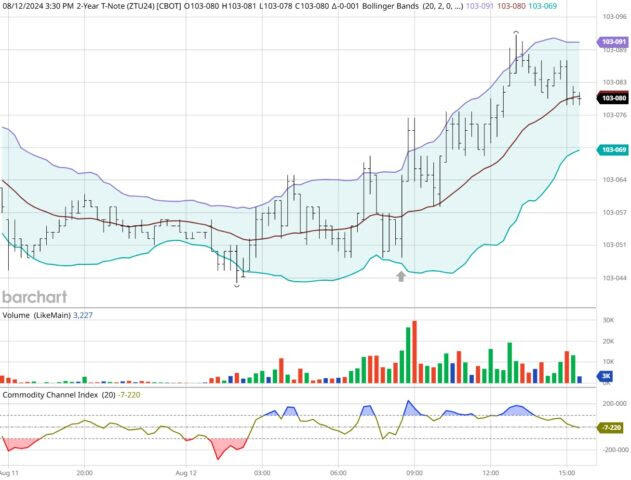
ZT -Sept 2024 - 08/12.24
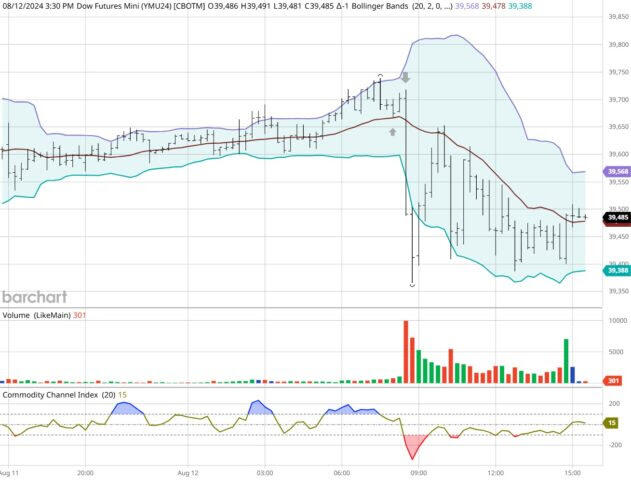
Dow - Sept 2024- 08/12/24
Bias
Yesterday we gave the markets a Neutral or Mixed bias as we didn't see much in the way of Market Correlation Monday morning, The Dow closed 141 points Lower but the S&P and Nasdaq both eked out a gain, though not by much. Today we aren't dealing with a correlated market and our bias is to the Upside.
Could this change? Of Course. Remember anything can happen in a volatile market.
Commentary
Over the weekend as reported by CNN we heard of a possible impending attack on Israel by Iran and Hezbollah. At first glance I paid no attention to it as sometimes rumors fly with no measure of truth. However, as yesterday's session progressed, my understanding is an aircraft carrier, and a submarine were put on High Alert and that is not a joking matter. Both are very lethal if it does come to pass then there could be a major war brewing in the Middle East. The markets as a general doesn't like certainty even though the markets themselves are anything but certain. The CNN report suggested that early this week an attack may be forthcoming. Could this or will this happen?? Remember anything can happen in a volatile market.
Trading performance displayed herein is hypothetical. The following Commodity Futures Trading Commission (CFTC) disclaimer should be noted.
Hypothetical performance results have many inherent limitations, some of which are described below. No representation is being made that any account will or is likely to achieve profits or losses similar to those shown.
In fact, there are frequently sharp differences between hypothetical performance results and the actual results subsequently achieved by any particular trading program. One of the limitations of hypothetical performance trading results is that they are generally prepared with the benefit of hindsight.
In addition, hypothetical trading does not involve financial risk, and no hypothetical trading record can completely account for the impact of financial risk in actual trading. For example, the ability to withstand losses or to adhere to a particular trading program in spite of trading losses are material points which can also adversely affect actual trading results.
There are numerous other factors related to the markets in general or to the implementation of any specific trading program which cannot be fully accounted for in the preparation of hypothetical performance results and all of which can adversely affect actual trading results.
Trading in the commodities markets involves substantial risk and YOU CAN LOSE A LOT OF MONEY, and thus is not appropriate for everyone. You should carefully consider your financial condition before trading in these markets, and only risk capital should be used.
In addition, these markets are often liquid, making it difficult to execute orders at desired prices. Also, during periods of extreme volatility, trading in these markets may be halted due to so-called “circuit breakers” put in place by the CME to alleviate such volatility. In the event of a trading halt, it may be difficult or impossible to exit a losing position.
Recommended Content
Editors’ Picks
EUR/USD edges higher toward 1.0950 after US PPI data

EUR/USD gains traction and trades in positive territory slightly below 1.0950 in the early American session. The data from the US showed that annual producer inflation softened to 2.2% in July from 2.7% in June, limiting the USD's gains and helping the pair push higher.
GBP/USD trades at fresh weekly highs above 1.2800

GBP/USD extends its recovery and trades at a fresh weekly high above 1.2800 on Tuesday. The upbeat employment data from the UK supports Pound Sterling, while the soft US producer inflation reading for July provides an additional boost to the pair.
Gold holds steady near $2,470 following Monday's upsurge

Gold stays in a consolidation phase at around $2,470 after rising more than 1.5% on Monday. The benchmark 10-year US Treasury bond yield edges lower and stays below 3.9% after US PPI data, allowing XAU/USD to hold its ground.
Sui price is poised for a rally following a retest of the breakout level
Sui (SUI) broke above the falling wedge pattern on Thursday and surged 19% in the subsequent four days, but as of Tuesday, it is experiencing a pullback, trading 4.8% lower at $0.96 at the time of writing.
In the thick of the summer doldrums

We’re in the thick of the summer doldrums and markets have for the most part been confined to some tight consolidation trade. The economic calendar has been rather anaemic as well, further contributing to the uneventful price action.