GBP/USD rollercoaster ride in Q1 – Will the pair continue upside rally in 2025?
-
Ongoing uncertainties exert pressure on the Pound.
-
Inflation remains above BoE's 2% target.
-
GBP/USD rises 3.5% YTD.
In the first quarter of 2025, the British Pound experienced significant fluctuations against the dollar. GBPUSD began the year at approximately 1.2500, dipped to a low of 1.2100 on January 13, and surged to a high of 1.3014 by mid-March, having an overall performance of 3.5% year-to-date. This volatility was driven by a mix of economic factors and policy decisions.
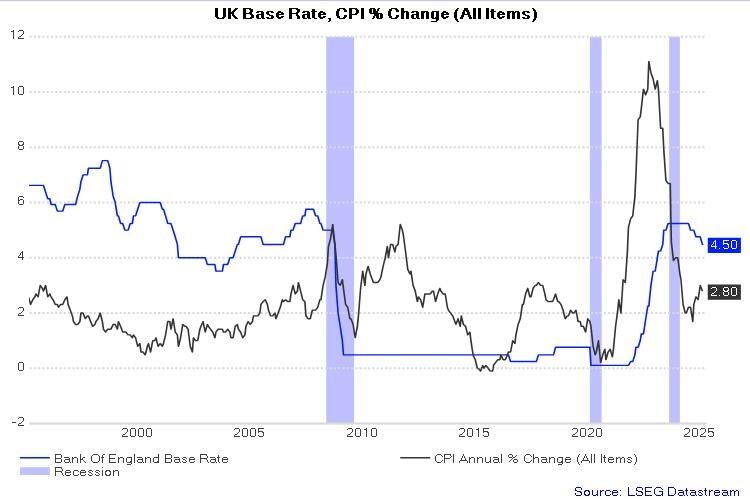
The Bank of England (BoE) played a pivotal role in shaping the pound's movement. In February, the BoE reduced the interest rate by 25 basis points to 4.5%. This move aimed to bolster economic growth amid slowing inflation and subdued domestic demand. While the rate cut provided some economic relief, it also contributed to the pound's initial depreciation.
As of February, the UK's CPI figure slowed to 2.8% y/y, down from 3.0% in the previous month. However, the inflation rate remained above the BoE's target of 2%, indicating persistent price pressures. The pound's recovery towards the end of the quarter suggests cautious optimism, but the outlook remains dependent on future economic developments and policy decisions.
Technical outlook
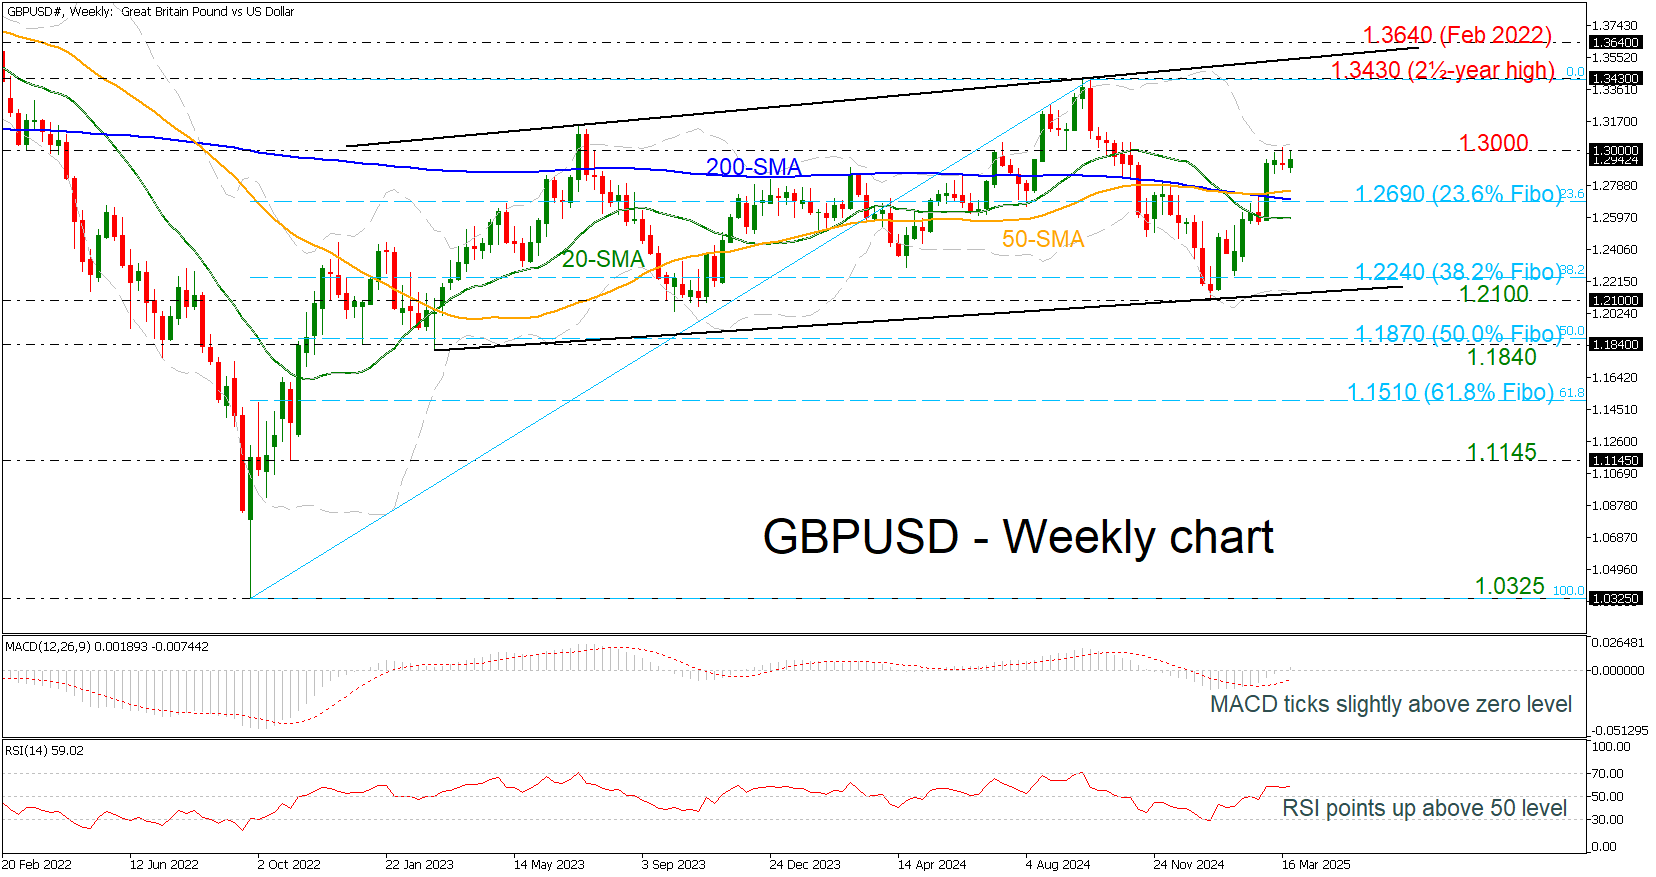
Zooming into the weekly chart, GBPUSD has struggled beneath the 1.3000 round number over the last few weeks after the strong rebound off the 1.2100 critical level and the long-term uptrend line in mid-January.
The bullish wave will be confirmed if the pair breaks the 1.3000 significant barrier with the next resistance coming from the two-a-and-half-year high of 1.3430. Even higher, the bulls could fight with the return line of the bullish tendency around 1.3570 ahead of February’s 2022 peaks at 1.3640.
In the negative scenario, a slide beneath the crucial 23.6% Fibonacci retracement level of the up leg from 1.0325 to 1.3430 at 1.2690, which overlaps with the 200-day simple moving average (SMA) may raise the likelihood for another bearish wave to 38.2% Fibonacci at 1.2240. Lower, the uptrend line and the 1.2100 barriers may halt bearish actions.
Technically, the MACD oscillator is tilting marginally up, above the zero level, while the RSI indicator is pointing north above the neutral threshold of 50.
To sum up, the overall outlook of GBPUSD is still positive in the long-term view and only a dive below 1.2100 could change this.
Author

Melina joined XM in December 2017 as an Investment Analyst in the Research department. She can clearly communicate market action, particularly technical and chart pattern setups.


