GBP/USD Forecast: Sterling is oversold, could find a bottom and then bounce
- GBP/USD has been extending its falls, hitting the lowest in a month.
- Fear of covid and the Fed may exert additional temporary pressure on cable.
- Friday's four-hour chart is pointing to an imminent bounce.
How low can sterling go? Further than many had thought, it seems. GBP/USD is down some 200 pips on the week in a sharp move mostly recorded after the Federal Reserve's meeting minutes raised expectations of tapering. If the Fed prints fewer dollars, the currency is worth more.
Another greenback booster has come to the forefront. The Delta covid variant has been gaining attention, especially after reports of overwhelmed Intensive Care Units (ICUs) in Alabama and the illness of three Senators. All were fully vaccinated. The White House's intent to allow Americans of all ages to receive booster shots is also dampening the mood.
Britain's covid statistics are far from satisfying, and that is weighing on the pound. The vaccination campaign has all but stalled and infections are on the rise.
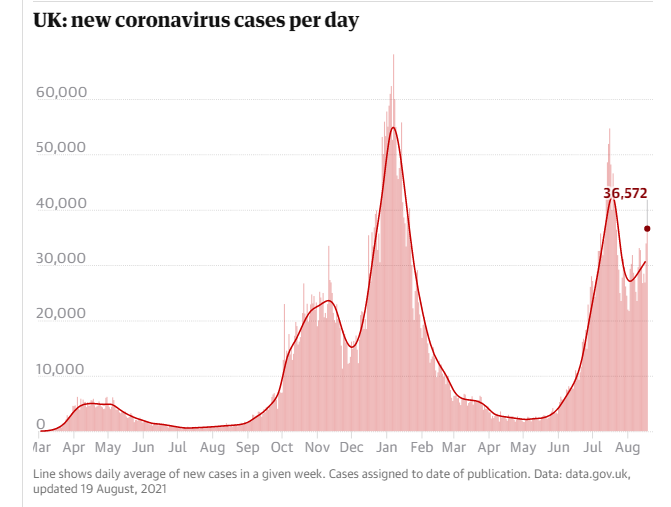
Source: The Guardian
With all this doom and gloom, is the only way down? Probably not for too long. Delta infections may eventually peak in the US and in the short term, the Fed will likely refrain from moving too aggressively. It is essential to remember that the meeting minutes came before a long list of disappointing figures and that inflation may have hit a peak. Or, it is at least cresting.
See Dollar selling opportunity? Three reasons (and charts) explaining why the King may crash
However, such a change of mood may have to wait for next week. Investors are more likely to take risks off the table ahead of the weekend.
On Friday, technicals could help the pound stabilize.
GBP/USD Technical Analysis
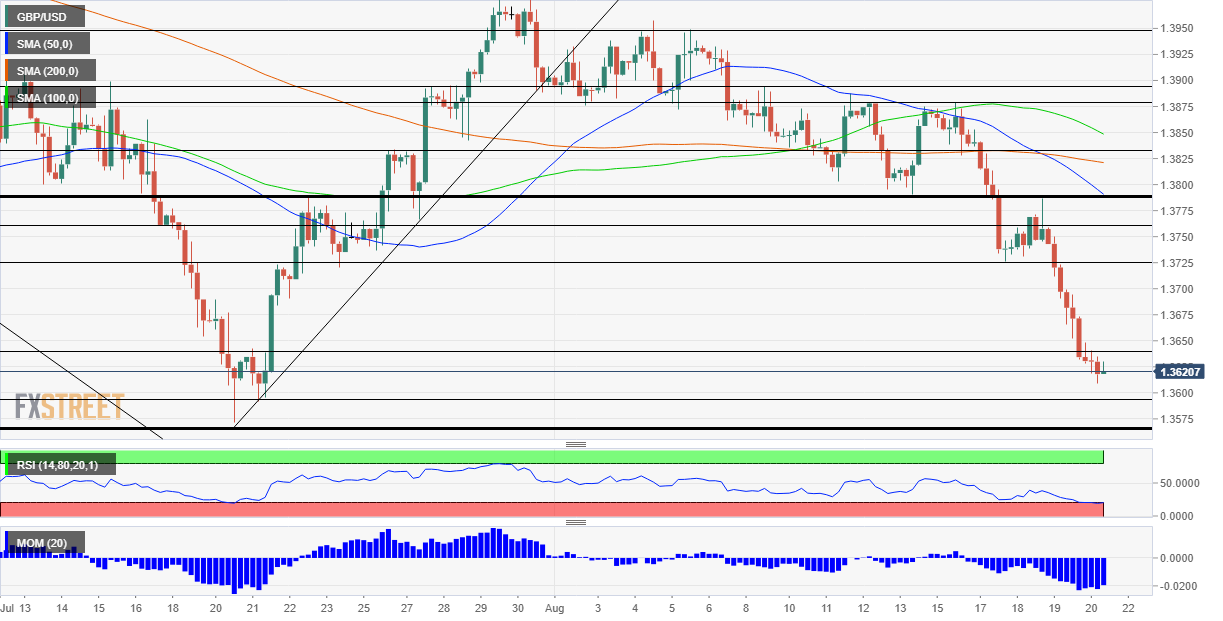
The Relative Strength Index on the four-hour chart is at 20 – reflecting extreme oversold conditions. When the RSI last hit such levels, it staged a sharp bounce. In addition, the fact that cable is nearing the critical 1.3560 support line – last recorded in July – may provoke buyers to jump in. Other indicators such as momentum are pointing down.
Ahead of 1.3560, the initial cushion is at 1.3595, which was another low point in July. Below 1.3560, the round 1.35 level comes into play.
Looking up, some resistance is at 1.3630, a resistance line from last month, and further above, 1.3725 held GBP/USD up before it tumbled down earlier this week.
Premium
You have reached your limit of 3 free articles for this month.
Start your subscription and get access to all our original articles.
Author

Yohay Elam
FXStreet
Yohay is in Forex since 2008 when he founded Forex Crunch, a blog crafted in his free time that turned into a fully-fledged currency website later sold to Finixio.


