GBP/USD Forecast: Pound Sterling struggles to benefit from hot UK inflation data
- GBP/USD has lost traction after having advanced beyond 1.2450.
- Core inflation in the UK rose unexpectedly in April.
- Souring market mood doesn't allow the pair to hold its ground.

GBP/USD has reversed its direction and erased the majority of its daily gains following the initial upsurge seen on the UK inflation data. The near-term technical outlook suggests that sellers look to continue to dominate the action as the pair stays below key resistance level that aligns at 1.2450.
The UK's Core Consumer Price (CPI) rose 6.8% on a yearly basis in April, according to data from the Office for National Statistics published early Wednesday. This reading surpassed the market expectation and the March increase of 6.2% by a wide margin. Although the annual CPI came in at 8.7%, compared to 10.1% in March, it beat analysts' estimate of 8.2%.
According to Reuters, UK financial markets are now fully pricing in the Bank of England's (BoE) policy rate rising to 5.25% by the end of 2023 and see an 80% chance of a peak rate of 5.5%.
Despite the hawkish tilt seen in market positioning after hot inflation data, Pound Sterling is having a difficult time finding demand amid risk aversion. The UK's FTSE 100 Index is down more than 1.5% in early trading and US stock index futures are down between 0.25% and 0.3%.
In the second half of the day, the US Federal Reserve (Fed) will release the minutes of the May policy meeting. The CME Group FedWatch Tool shows that the probability of the Fed leaving its policy rate unchanged in June stays around 80%.
Investors have been trying to figure out whether the Fed will opt for a rate cut toward the end of the year. Hence, May policy meeting minutes are unlikely to offer fresh clues, especially ahead of the June policy statement that will include the revised Summary of Economic Projections (SEP). Consequently, the risk perception should remain as the primary driver of the US Dollar's valuation in the second half of the day.
GBP/USD Technical Analysis
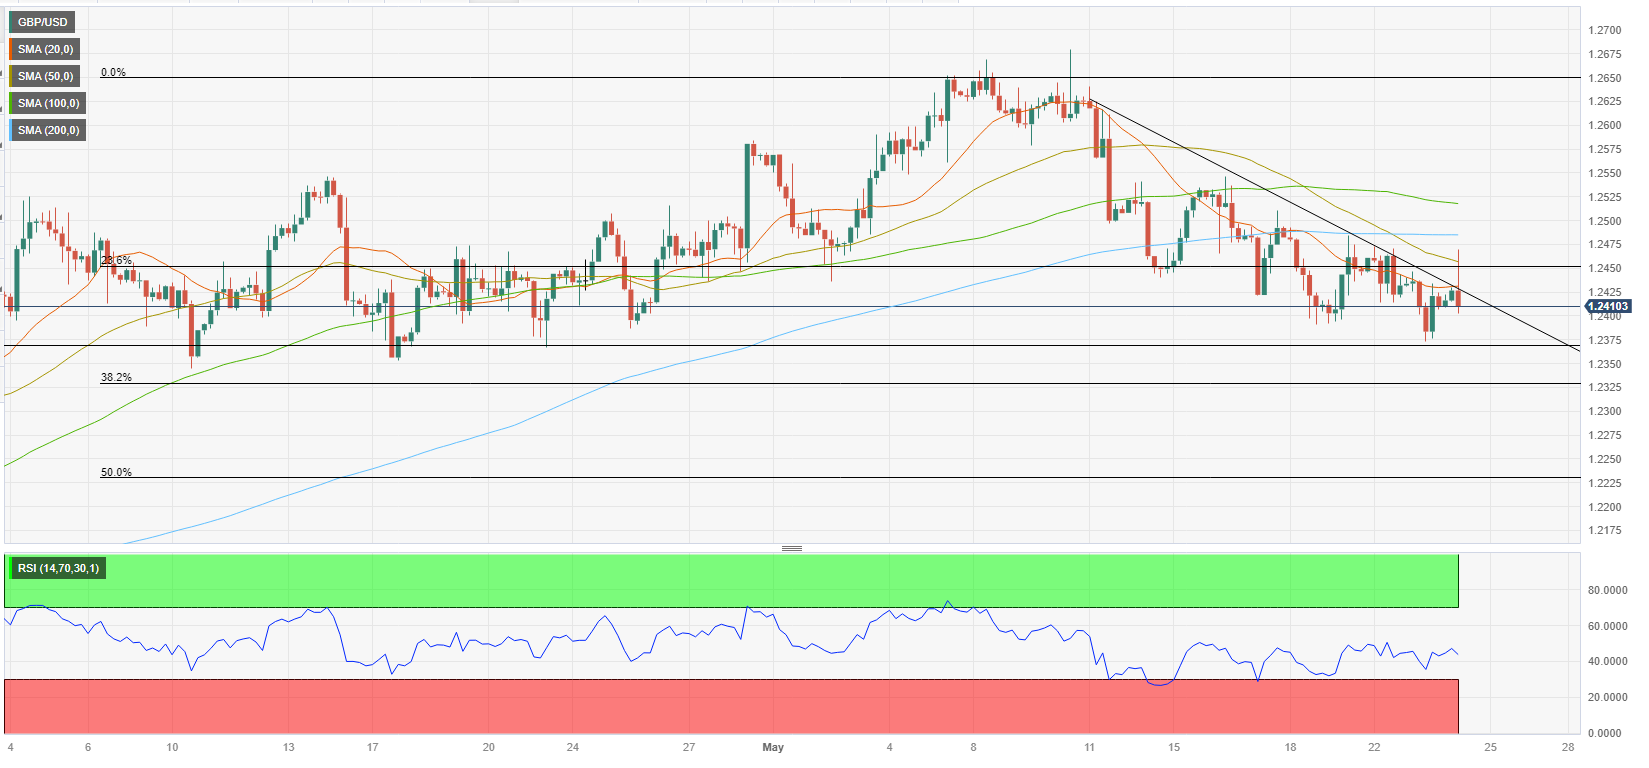
GBP/USD rose above 1.2450 (Fibonacci 23.6% retracement of the latest uptrend, 50-period Simple Moving Average (SMA) on the four-hour chart) but failed to stabilize above that level. Reflecting the bearish bias, the pair returned below the descending trend line and the Relative Strength Index (RSI) started to edge lower toward 40.
On the downside, first support is located at 1.2400 ahead of 1.2360 (static level) and 1.2330 (Fibonacci 38.2% retracement of the latest uptrend). Resistances align at 1.2450, 1.2480 (200-period SMA) and 1.2500 (psychological level).
Premium
You have reached your limit of 3 free articles for this month.
Start your subscription and get access to all our original articles.
Author

Eren Sengezer
FXStreet
As an economist at heart, Eren Sengezer specializes in the assessment of the short-term and long-term impacts of macroeconomic data, central bank policies and political developments on financial assets.


