GBP/USD Forecast: Pound Sterling faces next key support at 1.2260
- GBP/USD has advanced above 1.2300 following the decline in Asian session.
- Sellers could take action if the pair drops below 1.2260.
- Investors are concerned above energy inflation on rising crude oil prices.

GBP/USD has started the new week under bearish pressure and declined below 1.2300 before staging a rebound in the European morning. The pair could have a difficult time regaining its traction unless the market mood improves later in the day.
Investors are concerned about rising crude oil prices causing energy inflation to remain uncomfortably high. The decision by some OPEC+ producers to voluntarily reduce output by a total of more than 1 million barrels per day until the end of the year caused crude oil prices to surge higher at the beginning of the week. The barrel of Brent was last seen rising more than 6% on the day at $84.50.
In case safe-haven flows drive the action in financial markets in the second half of the day, the US Dollar could continue to gather strength and weigh on GBP/USD. As of writing, S&P 500 Futures were down 0.15% on the day while Dow Futures were up 0.3%.
Meanwhile, the CME Group FedWatch Tool shows that the probability of a 25 basis points Federal Reserve (Fed) rate hike in May rose above 60% from 48% on Friday.
Later in the day, hawkish Fed bets could help the USD find demand in case the ISM Manufacturing PMI survey reveals an increase in the sector's input inflation. The Priced Paid Index is forecast to edge higher to 53.8 in March from 51.3 in February. On the flip side, a decisive rebound above 50 in the headline PMI, which is expected to come in at 47.5, could help the risk sentiment to improve and limit the USD's upside.
GBP/USD Technical Analysis
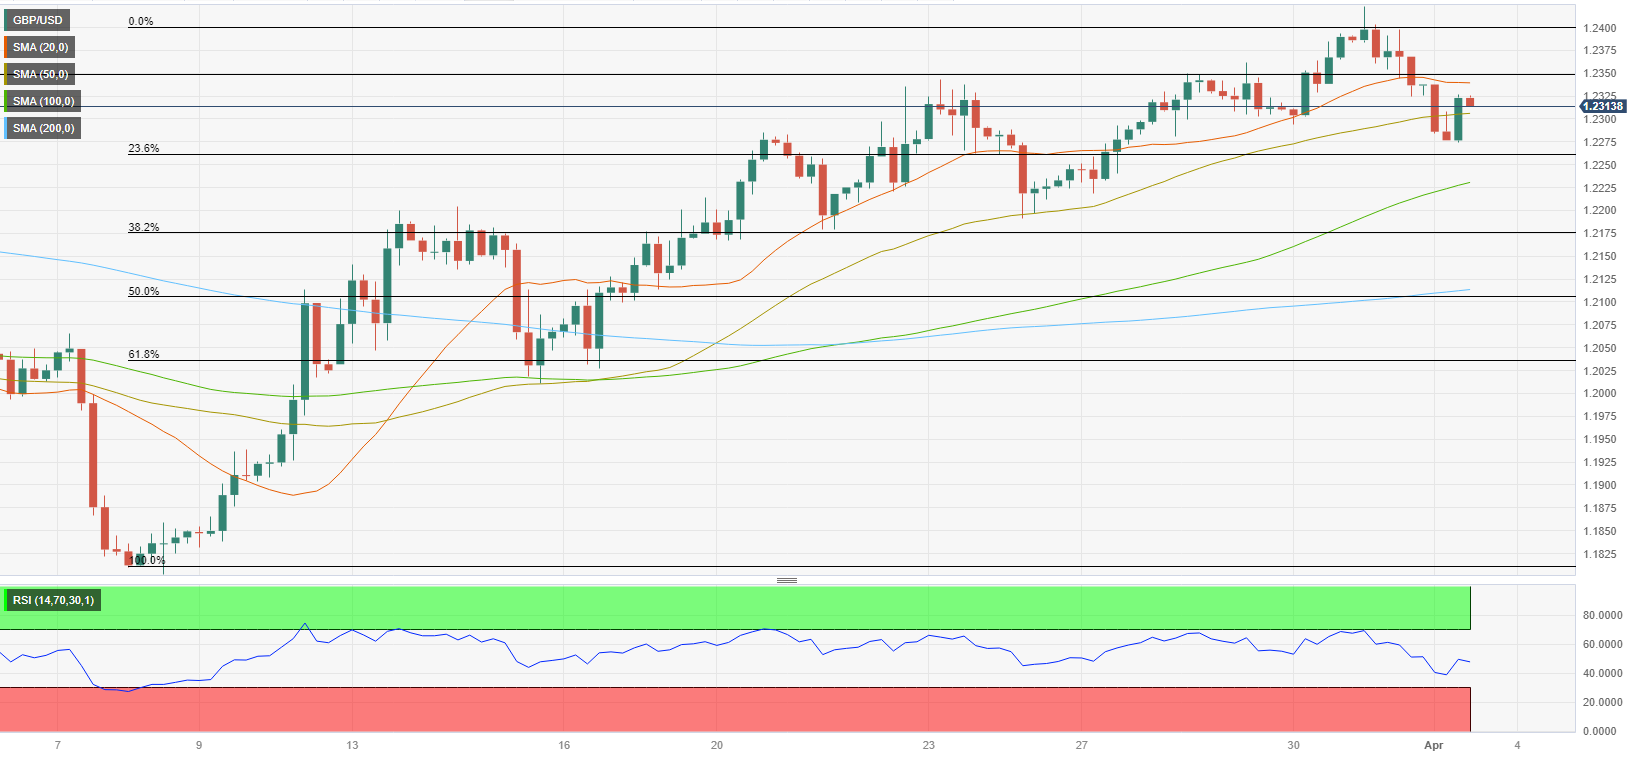
In case GBP/USD confirms 1.2300 as resistance, the next key support is located at 1.2260 (Fibonacci 23.6% retracement) before 1.2230 (100-period Simple Moving Average (SMA)) and 1.2200 (psychological level).
On the upside, 1.2350 (static level, 20-period SMA), aligns as first resistance ahead of 1.2400 (end-point of the latest uptrend) and 1.2420 (multi-month high set on March 31).
It's worth noting that the Relative Strength Index (RSI) indicator on the four-hour chart struggles to rise above 50, highlighting buyers' hesitancy for the time being.
Premium
You have reached your limit of 3 free articles for this month.
Start your subscription and get access to all our original articles.
Author

Eren Sengezer
FXStreet
As an economist at heart, Eren Sengezer specializes in the assessment of the short-term and long-term impacts of macroeconomic data, central bank policies and political developments on financial assets.


