GBP/USD Forecast: Pound Sterling faces key resistance at 1.2450
- GBP/USD continues to fluctuate in a narrow channel above 1.2400 on Friday.
- The pair needs to flip 1.2450 into support to extend its uptrend.
- Improving risk mood could cause the USD to weaken further ahead of the weekend.

After closing the day virtually unchanged slightly above 1.2400, GBP/USD edged slightly higher in the European session on Friday. The pair is likely to face stiff resistance at 1.2450 and technical buyers could take action once that level turns into support.
Uninspiring macroeconomic data releases from the US made it difficult for the US Dollar (USD) to find demand on Thursday. The number of first-time applications for unemployment benefits in the week ending November 11 rose to its highest level since August at 231,000. Additionally, Industrial Production contracted at a faster pace than anticipated in October.
The USD stays on the back foot on Friday as US Treasury bond yields continue to push lower following the sharp decline seen earlier in the week on soft inflation readings. The benchmark 10-year US Treasury yield was last seen losing more than 1% on the day slightly below 4.4%.
Pound Sterling price this week
The table below shows the percentage change of Pound Sterling (GBP) against listed major currencies this week. Pound Sterling was the strongest against the US Dollar.
| USD | EUR | GBP | CAD | AUD | JPY | NZD | CHF | |
| USD | -1.67% | -1.66% | -0.55% | -2.25% | -1.38% | -1.73% | -1.68% | |
| EUR | 1.64% | 0.00% | 1.09% | -0.58% | 0.26% | -0.06% | -0.01% | |
| GBP | 1.64% | 0.02% | 1.09% | -0.56% | 0.27% | -0.05% | 0.00% | |
| CAD | 0.57% | -1.08% | -1.08% | -1.66% | -0.80% | -1.14% | -1.09% | |
| AUD | 2.21% | 0.58% | 0.55% | 1.64% | 0.83% | 0.51% | 0.56% | |
| JPY | 1.36% | -0.26% | -0.26% | 0.83% | -0.88% | -0.33% | -0.27% | |
| NZD | 1.71% | 0.09% | 0.06% | 1.15% | -0.51% | 0.32% | 0.05% | |
| CHF | 1.65% | 0.02% | 0.00% | 1.09% | -0.56% | 0.28% | -0.05% |
The heat map shows percentage changes of major currencies against each other. The base currency is picked from the left column, while the quote currency is picked from the top row. For example, if you pick the Euro from the left column and move along the horizontal line to the Japanese Yen, the percentage change displayed in the box will represent EUR (base)/JPY (quote).
Meanwhile, the UK's FTSE 100 Index is up nearly 1% and US stock index futures trade modestly higher on the day, pointing to an improving risk mood.
If risk flows dominate the financial markets in the second half of the day, GBP/USD could add to this week's gains. Housing Starts and Building Permits for October will be featured in the US economic docket but investors are unlikely to react to these data.
GBP/USD Technical Analysis
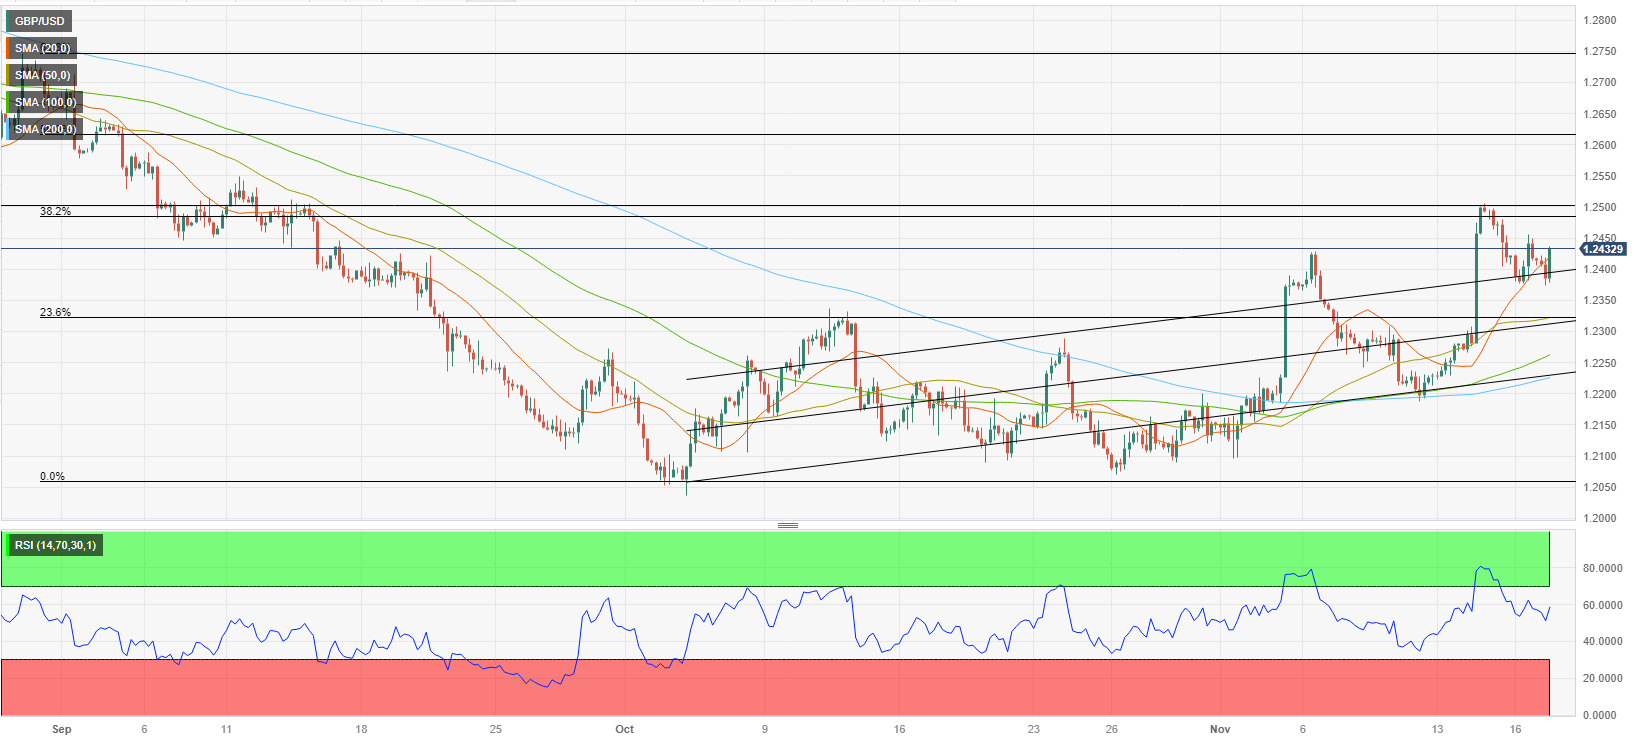
The 200-day Simple Moving Average (SMA) aligns as strong resistance at 1.2450 for GBP/USD. Once the pair makes a daily close above that level and confirms it as support, 1.2500 (psychological level, Fibonacci 38.2% retracement of the July-October downtrend, 100-day SMA) and 1.2600 (Fibonacci 50% retracement) could be set as next bullish targets.
On the downside, first support is located at 1.2400 (psychological level, static level) before 1.2330 (50-period SMA on the 4-hour chart) and 1.2300 (psychological level, static level).
Premium
You have reached your limit of 3 free articles for this month.
Start your subscription and get access to all our original articles.
Author

Eren Sengezer
FXStreet
As an economist at heart, Eren Sengezer specializes in the assessment of the short-term and long-term impacts of macroeconomic data, central bank policies and political developments on financial assets.


