GBP/USD Forecast: Pound Sterling could struggle to extend uptrend
- GBP/USD consolidates weekly gains under 1.2700 on Thursday.
- The technical outlook suggests that the bullish bias stays intact.
- Risk aversion could help the US Dollar continue to gather strength.

GBP/USD lost some traction early Thursday, declining toward 1.2650 after having touched its highest level since April 2022 at 1.2700 on Wednesday. Although the technical outlook shows that the bullish bias stays unchanged, the pair might find it difficult to extend its uptrend in case market mood sours in the second half of the day.
The Federal Reserve (Fed) held the policy rate steady at the 5%-5.25% range following the June policy meeting, as expected. However, the revised Summary of Projections (SEP), the so-called dot plot, showed that the majority of policymakers see interest rates increasing by 25 basis points (bps) twice until the end of the year.
The US Dollar Index erased a large portion of its weekly losses after the Fed event, reflecting the positive impact of the hawkish dot plot on the US Dollar's (USD) valuation.
In the second half of the day, the weekly Initial Jobless Claims and May Retail Sales data from the US will be watched closely by market participants. In case the number of applications for unemployment benefits decline by more than 30,000, the USD could continue to gather strength, causing GBP/USD to stretch lower and vice versa.
According to the CME Group FedWatch Tool, markets are currently pricing in a 72% probability of a 25 bps Fed rate increase in July, suggesting that the USD has more room on the upside if hawkish Fed bets dominate market action.
In the meantime, US stock index futures are down between 0.1% and 0.5% in the European session. A negative opening in Wall Street and a sharp decline in the main equity indices should help the USD to outperform its risk-sensitive rivals like the Pound Sterling.
GBP/USD Technical Analysis
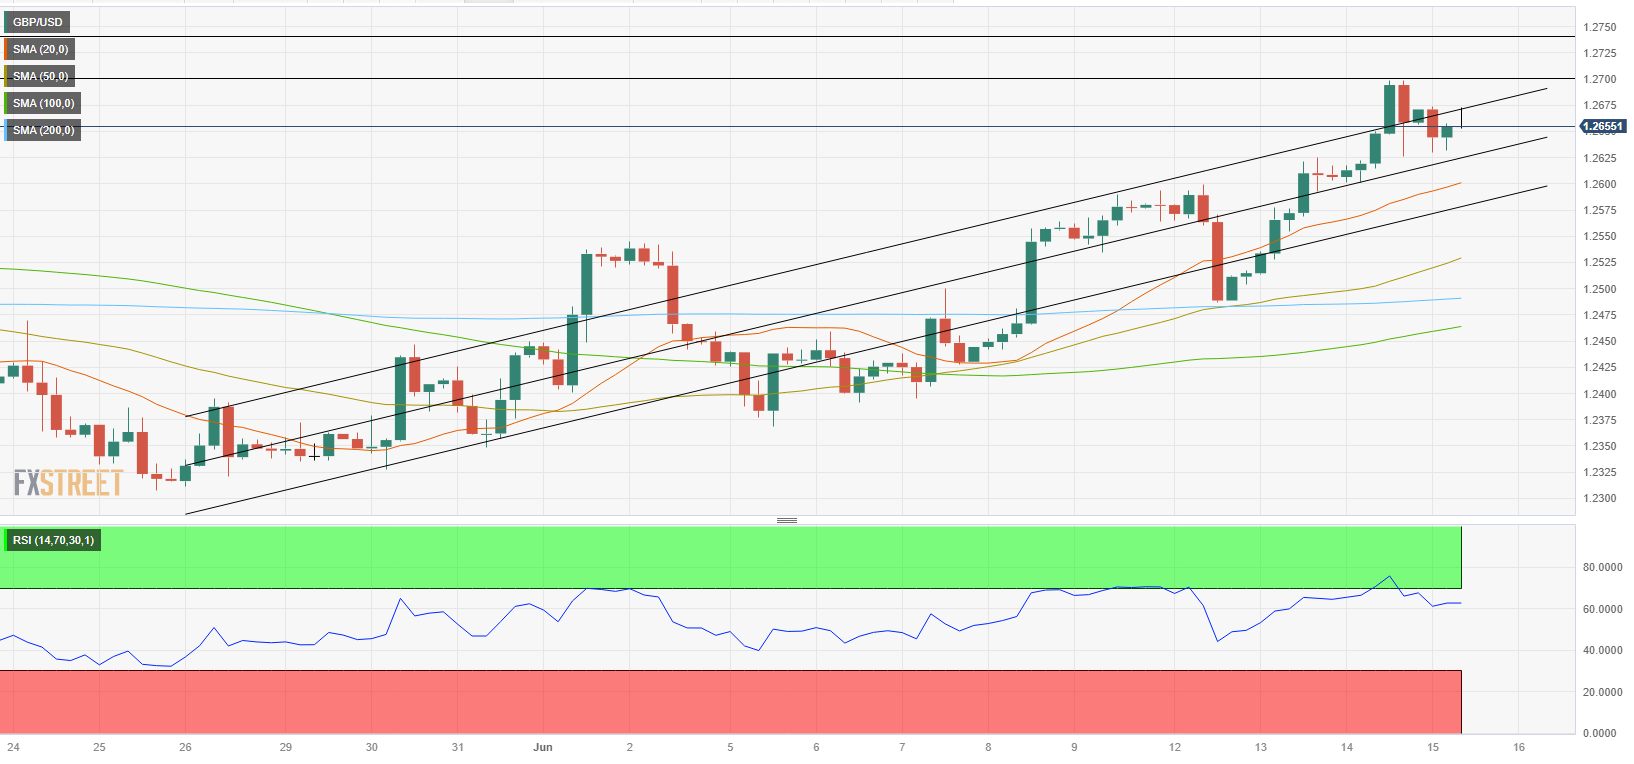
The Relative Strength Index (RSI) indicator on the four-hour chart stays near 60, and GBP/USD trades within the upper-half of the ascending regression channel, highlighting the near-term bullish bias.
On the downside, 1.2630 (mid-point of the ascending channel) aligns as initial support ahead of 1.2600/1.2590 (lower-limit of the ascending channel, 20-period Simple Moving Average (SMA) on the four-hour chart). A four-hour close below the latter could attract bears and cause GBP/USD to stage a deeper downward correction to 1.2525 (50-period SMA).
First technical resistance is located at 1.2670 (upper-limit of the ascending channel) before 1.2700 (psychological level, 14-month high set on Wednesday) and 1.2740 (static level from June 2019).
Premium
You have reached your limit of 3 free articles for this month.
Start your subscription and get access to all our original articles.
Author

Eren Sengezer
FXStreet
As an economist at heart, Eren Sengezer specializes in the assessment of the short-term and long-term impacts of macroeconomic data, central bank policies and political developments on financial assets.


