• GBP/USD trades in negative territory below 1.2600 early Wednesday.
  • Annual CPI inflation in the UK held steady at 4% in January.
  • Improving risk mood helps the pair limit its losses for now.

After closing in negative territory on Tuesday, GBP/USD continued to push lower in the European session on Wednesday and touched its lowest level in over a week below 1.2550. The near-term technical outlook suggests that the pair has more room on the downside before turning technically overbought.

January Consumer Price Index (CPI) readings from the US triggered a US Dollar rally in the American trading hours on Tuesday and caused GBP/USD to decline sharply. On a monthly basis, the CPI and the Core CPI, which excludes volatile food and energy prices, rose 0.3% and 0.4%, respectively. Both of these reading came in above analysts' estimates and provided a boost to the USD. 

Early Wednesday, the UK's Office for National Statistics (ONS) reported that the annual CPI inflation and core CPI inflation held steady at 4% and 5.1%, respectively. Monthly CPI declined 0.6% in January, while the monthly Retail Price Index fell 0.3%. Although these prints are not weak enough for Bank of England policymakers to reconsider the timing of a policy pivot, they still make it difficult for Pound Sterling to stage a rebound.

In the meantime, the UK's FTSE 100 Index opened higher on Wednesday and US stock index futures turned positive on the day after spending the Asian session moving sideways. In case risk flows start to dominate the action in financial markets in the second half of the day, the USD could lose some interest and help GBP/USD find a foot hold.

Later in the day, BoE Governor Andrew Bailey will be testifying before the Lords Economic Affairs Committee. In case Bailey acknowledges the latest inflation data as welcoming news, GBP/USD could struggle to gain traction. On the other hand, Pound Sterling could find demand if Bailey adopts a cautious tone regarding a policy pivot, citing underlying strength in inflation despite January's encouraging prints. 

GBP/USD Technical Analysis

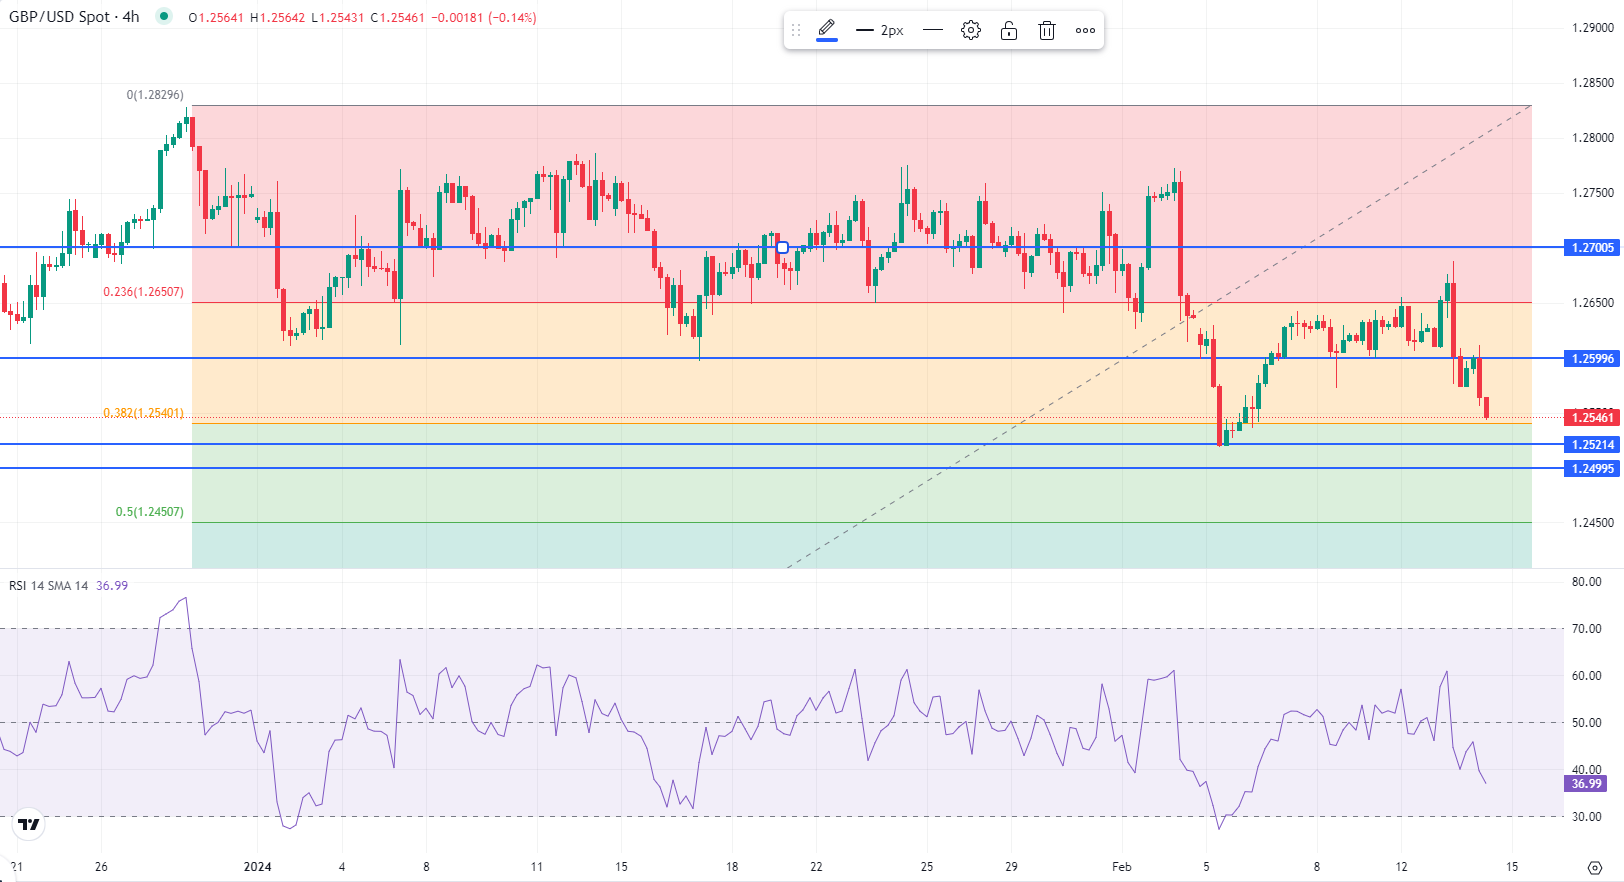
The Relative Strength Index (RSI) indicator on the 4-hour chart declined below 40, highlighting a buildup of bearish momentum. On the downside, 1.2520 (February 5 low) aligns as interim support before 1.2500 (psychological level, static level) and 1.2450 (Fibonacci 50% retracement of the latest uptrend).

Looking north, 1.2600 (former support, static level) could be seen as first resistance before 1.2650 (Fibonacci 23.6% retracement) and 1.2700 (static level).

Information on these pages contains forward-looking statements that involve risks and uncertainties. Markets and instruments profiled on this page are for informational purposes only and should not in any way come across as a recommendation to buy or sell in these assets. You should do your own thorough research before making any investment decisions. FXStreet does not in any way guarantee that this information is free from mistakes, errors, or material misstatements. It also does not guarantee that this information is of a timely nature. Investing in Open Markets involves a great deal of risk, including the loss of all or a portion of your investment, as well as emotional distress. All risks, losses and costs associated with investing, including total loss of principal, are your responsibility. The views and opinions expressed in this article are those of the authors and do not necessarily reflect the official policy or position of FXStreet nor its advertisers. The author will not be held responsible for information that is found at the end of links posted on this page.

If not otherwise explicitly mentioned in the body of the article, at the time of writing, the author has no position in any stock mentioned in this article and no business relationship with any company mentioned. The author has not received compensation for writing this article, other than from FXStreet.

FXStreet and the author do not provide personalized recommendations. The author makes no representations as to the accuracy, completeness, or suitability of this information. FXStreet and the author will not be liable for any errors, omissions or any losses, injuries or damages arising from this information and its display or use. Errors and omissions excepted.

The author and FXStreet are not registered investment advisors and nothing in this article is intended to be investment advice.

Recommended Content


Recommended Content

Editors’ Picks

Gold price jumps to fresh record high above $3,200 on US-China tariff war

Gold price jumps to fresh record high above $3,200 on US-China tariff war

Gold price sits at all-time highs of $3,219 in the Asian session on Friday. The weakening of the US Dollar and escalating trade war between the US and China provide some support to traditional safe haven asset Gold price amid increased dovish Fed expectations. 

Gold News
USD/JPY recovers losses in sync with US Dollar, retakes 143.50

USD/JPY recovers losses in sync with US Dollar, retakes 143.50

USD/JPY is trimming losses to retest 143.50 in Asian trading hours on Friday, having tested levels under 143.00. The pair is tracking the US Dollar price action amid persistent trade jitters and US recession fears. The Fed-BoJ divergent policy expectations support the Japanese Yen, keep the weight intact on the pair.  

USD/JPY News
AUD/USD consolidates weekly gains near 0.6250 despite trade tensions

AUD/USD consolidates weekly gains near 0.6250 despite trade tensions

AUD/USD consolidates weekly gains near 0.6250 in Asian trading on Friday. The pair capitalizes on sustained US Dollar weakness even as risk aversion remains at full steam on deepening US-China trade war. The White House confirmed on Thursdayt that the cumulative US tariffs on Chinese goods have risen to 145%.

AUD/USD News
Can Trump's tariff pause and declining inflation keep Bitcoin afloat? Experts weigh in

Can Trump's tariff pause and declining inflation keep Bitcoin afloat? Experts weigh in

Bitcoin dived below $80,000 on Thursday despite US Consumer Price Index data coming in lower than expected and President Donald Trump's 90-day reciprocal tariffs pause on 75 countries.

Read more
Trump’s tariff pause sparks rally – What comes next?

Trump’s tariff pause sparks rally – What comes next?

Markets staged a dramatic reversal Wednesday, led by a 12% surge in the Nasdaq and strong gains across major indices, following President Trump’s unexpected decision to pause tariff escalation for non-retaliating trade partners. 

Read more
The Best brokers to trade EUR/USD

The Best brokers to trade EUR/USD

SPONSORED Discover the top brokers for trading EUR/USD in 2025. Our list features brokers with competitive spreads, fast execution, and powerful platforms. Whether you're a beginner or an expert, find the right partner to navigate the dynamic Forex market.

Read More

Majors

Cryptocurrencies

Signatures

Best Brokers of 2025