GBP/USD Forecast: It's all about new PM Sunak's fiscal plan
- GBP/USD has stabilized above 1.1300 following Monday's choppy action.
- Rishi Sunak won the Tory leadership race to become the new prime minister as expected.
- The greenback could regather strength in case US stocks turn south.

GBP/USD has gathered bullish momentum early Tuesday and climbed above 1.1300. The near-term technical outlook suggests that buyers look to continue to dominate the pair's action but investors could refrain from betting on further pound strength amid the uncertainty surrounding new British Prime Minister Rishi Sunak's fiscal plan.
Sir Graham Brady, chair of the 1922 Committee, announced on Monday that Penny Mordaunt decided to drop out of the Tory leadership contest, leaving Rishi Sunak as the sole candidate to become the next Prime Minister.
Although the initial market reaction helped the UK's FTSE 100 Index gain traction and allowed the sterling to stay resilient against its rivals, market participants remain sceptical about GBP/USD's next direction. In a brief address on Monday, Sunak said that they were facing "profound economic challenges."
Currently, the fiscal plan is scheduled to be unveiled on October 31, a few days before the Bank of England's (BoE) monetary policy announcements. Some reports suggest that Sunak could postpone the budget announcement. In case the BoE is forced to set the policy rate before seeing the fiscal plan, it might refrain from taking an aggressive hawkish stance and cause the British pound to lose interest.
In the second half of the day, the Conference Board's Consumer Confidence Index data for October will be featured in the US economic docket. Monday's reaction to dismal S&P Global PMI figures from the US suggests that investors are looking for confirmation in macroeconomic data that the Fed might reach its peak hawkishness with a 75 basis points rate hike in November. Hence, disappointing confidence data could hurt the greenback and vice versa.
GBP/USD Technical Analysis
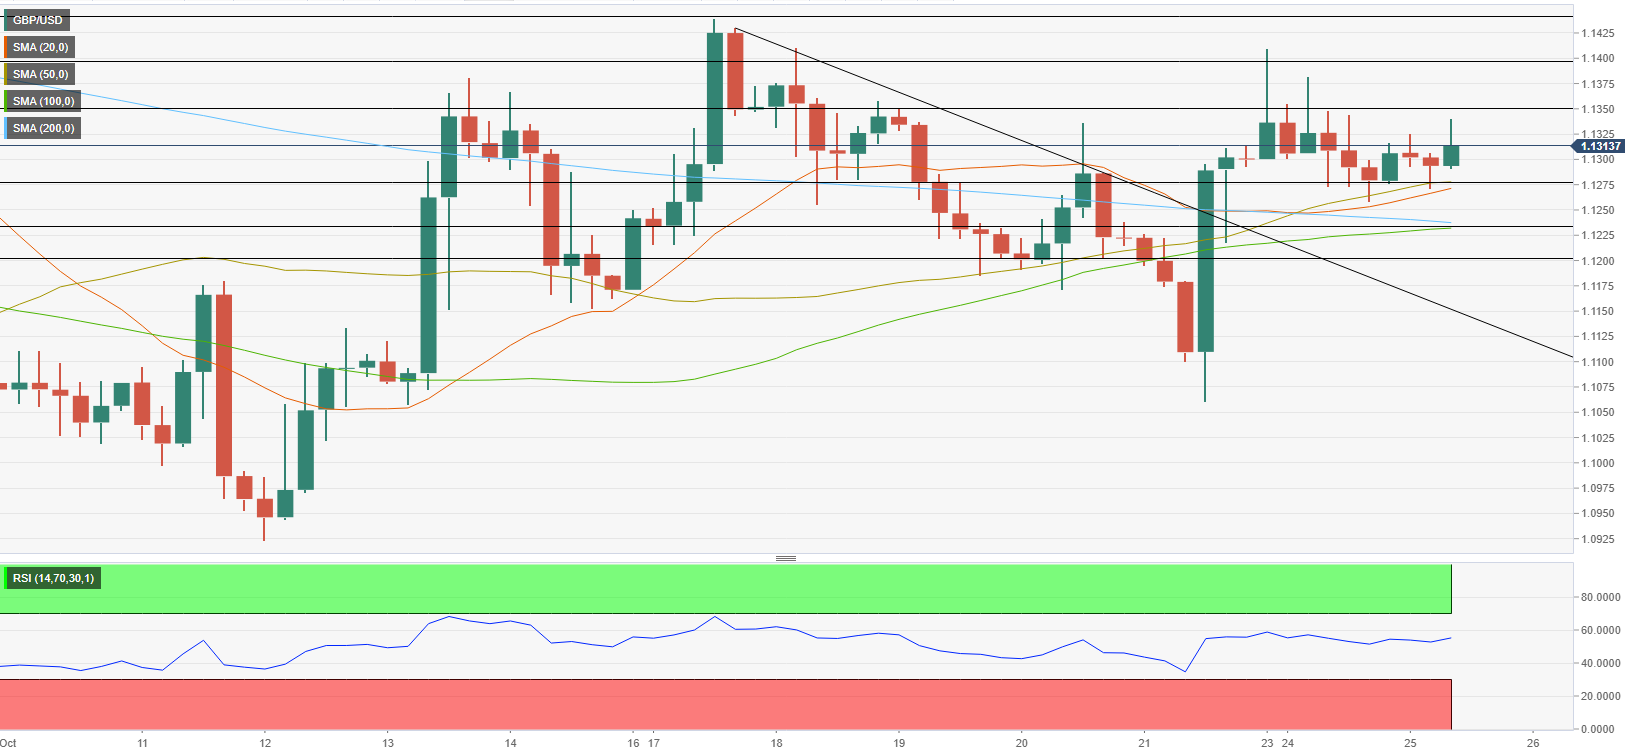
The Relative Strength Index (RSI) indicator on the four-hour chart edges higher toward 60, confirming the bullish bias in the near term. On the upside, 1.1350 (static level) aligns as initial hurdle before 1.1400 (psychological level) and 1.1440 (October 17 high).
Supports are located at 1.1275 (50-period SMA), 1.1235 (100-period SMA, 200-period SMA) and 1.1200 (psychological level).
Premium
You have reached your limit of 3 free articles for this month.
Start your subscription and get access to all our original articles.
Author

Eren Sengezer
FXStreet
As an economist at heart, Eren Sengezer specializes in the assessment of the short-term and long-term impacts of macroeconomic data, central bank policies and political developments on financial assets.


