GBP/USD Forecast: Buyers refuse to give up but 1.2700 proves to be a tough resistance
- GBP/USD fluctuates above 1.2650 after closing higher on Thursday.
- The near-term technical picture suggests that the bullish bias remains intact.
- A daily close above 1.2700 could be an encouraging sign for technical buyers.

GBP/USD gathered bullish momentum and climbed above 1.2700 for the first time in three weeks during the European trading hours on Thursday. The pair, however, lost its traction and erased a portion of its gains later in the American session. Early Friday, GBP/USD holds steady above 1.2650.
S&P Global/CIPS PMI data from the UK showed on Thursday that the business activity in the private sector continued to expand at an accelerating pace in early February, providing a boost to Pound Sterling. Later in the day, the PMI surveys from the US confirmed that the manufacturing and services sectors both remained in expansion territory. Other data from the US showed that the weekly Initial Jobless Claims declined by 12,000 to 201,000 in the week ending February 17.
Pound Sterling price this week
The table below shows the percentage change of Pound Sterling (GBP) against listed major currencies this week. Pound Sterling was the strongest against the Japanese Yen.
| USD | EUR | GBP | CAD | AUD | JPY | NZD | CHF | |
| USD | -0.42% | -0.44% | -0.01% | -0.56% | 0.31% | -1.08% | -0.04% | |
| EUR | 0.40% | -0.05% | 0.40% | -0.15% | 0.72% | -0.65% | 0.40% | |
| GBP | 0.46% | 0.06% | 0.44% | -0.10% | 0.77% | -0.60% | 0.45% | |
| CAD | 0.01% | -0.40% | -0.46% | -0.56% | 0.32% | -1.06% | -0.01% | |
| AUD | 0.56% | 0.15% | 0.10% | 0.56% | 0.87% | -0.50% | 0.55% | |
| JPY | -0.30% | -0.72% | -0.75% | -0.33% | -0.87% | -1.36% | -0.33% | |
| NZD | 1.06% | 0.65% | 0.59% | 1.04% | 0.50% | 1.36% | 1.01% | |
| CHF | 0.02% | -0.39% | -0.44% | 0.00% | -0.54% | 0.32% | -1.02% |
The heat map shows percentage changes of major currencies against each other. The base currency is picked from the left column, while the quote currency is picked from the top row. For example, if you pick the Euro from the left column and move along the horizontal line to the Japanese Yen, the percentage change displayed in the box will represent EUR (base)/JPY (quote).
As the benchmark 10-year US Treasury bond yield climbed to its highest level since late November at 4.35% after the US data, the US Dollar (USD) found a foothold and caused GBP/USD to retreat from multi-week highs.
The economic calendar will not offer and high-impact data releases from the UK nor the US on Friday. Hence, risk perception could drive GBP/USD's action ahead of the weekend.
The risk rally seen in global stock indexes on Thursday, fuelled by impressive gains recorded in major technology stocks, seems to have lost its steam already. At the time of press, Nasdaq futures were down 0.1% on the day. On Thursday, the Nasdaq Composite (IXIC) gained nearly 3%. In case Wall Street's main indexes stage a correction amid profit taking, GBP/USD could struggle to build on its weekly gains. On the other hand, another leg higher in US stocks could hurt the USD and support the pair.
GBP/USD Technical Analysis
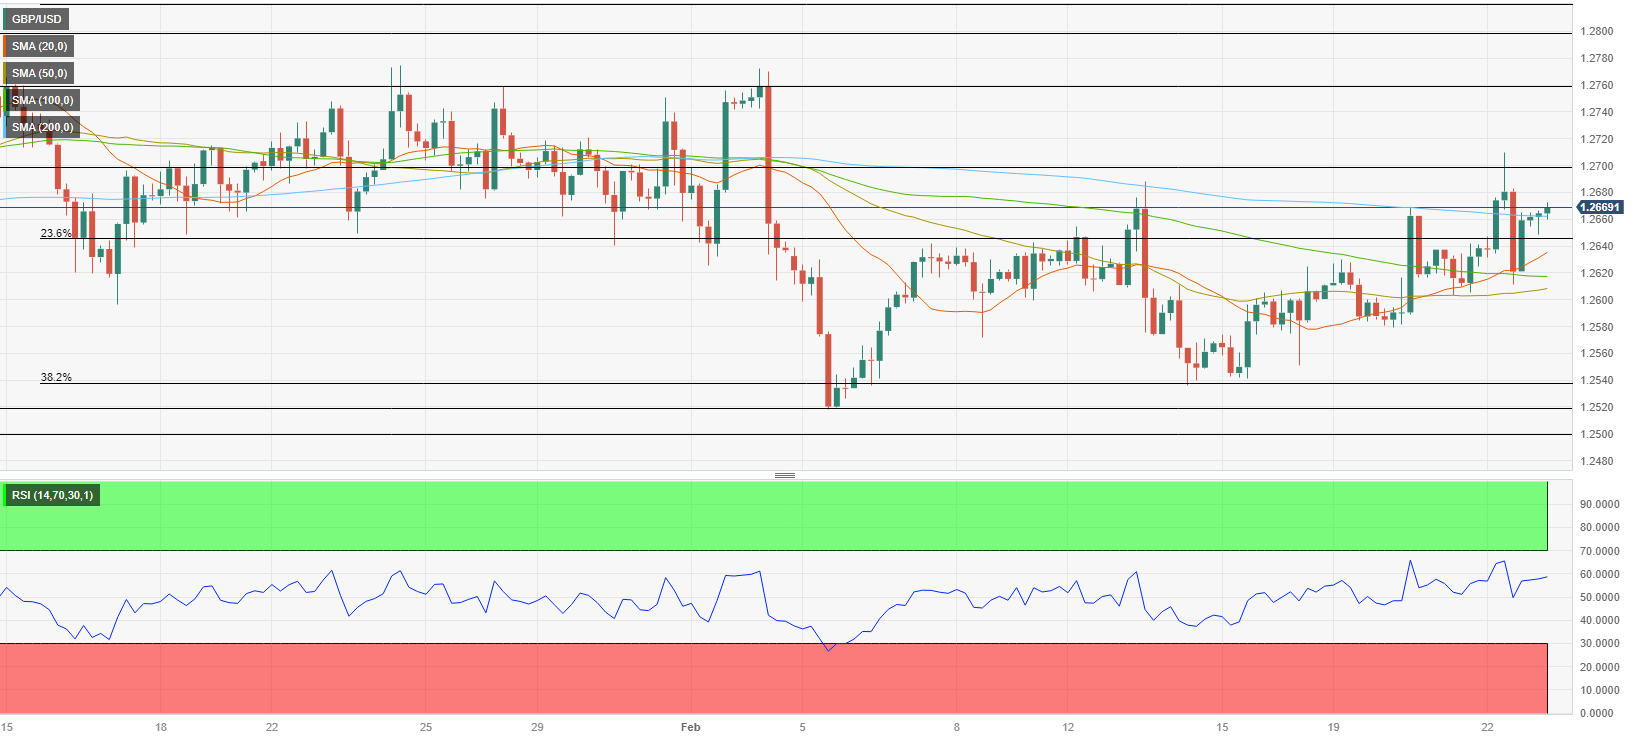
The 200-period Simple Moving Average (SMA) and the Fibonacci 23.6% retracement of the latest uptrend form key support at 1.2650-1.2660. After declining sharply below that area in the American session on Thursday, GBP/USD closed the last 3 4-hour candles above it, highlighting the lack of seller interest. Additionally, the Relative Strength Index (RSI) indicator edged higher toward 60 after finding support at 50 during the downward correction seen late Thursday.
On the upside, 1.2700 (psychological level, static level) aligns as immediate resistance before 1.2760 (static level) and 1.2800 (psychological level, static level).
If GBP/USD returns below 1.2660-1.2650 and starts using that region as resistance, 1.2620 (100-period SMA) and 1.2600 (psychological level, static level) could be seen as next support levels.
Premium
You have reached your limit of 3 free articles for this month.
Start your subscription and get access to all our original articles.
Author

Eren Sengezer
FXStreet
As an economist at heart, Eren Sengezer specializes in the assessment of the short-term and long-term impacts of macroeconomic data, central bank policies and political developments on financial assets.


