GBP/USD Forecast: Buyers hesitate after dismal UK data
- GBP/USD retreated below 1.2750 in the European session on Friday.
- Retail Sales in the UK declined sharply in July.
- The pair could stay on the back foot in the second half of the day.

GBP/USD failed to clear important technical resistance at 1.2770 and came under renewed bearish pressure following the disappointing UK data early Friday. The near-term technical outlook fails to offer directional clues but the cautious market stance is likely to make it difficult for the pair to gain traction ahead of the weekend.
Retail Sales in the UK declined 1.2% on a monthly basis in July. Retail Sales ex-Fuel contracted 1.4% in the same period. Both of these readings came in worse than analysts' estimate and cause Pound Sterling to weaken against its major rivals.
Pound Sterling price today
The table below shows the percentage change of Pound Sterling (GBP) against listed major currencies today. Pound Sterling was the weakest against the Japanese Yen.
| USD | EUR | GBP | CAD | AUD | JPY | NZD | CHF | |
| USD | 0.07% | 0.20% | -0.02% | 0.14% | -0.07% | 0.04% | 0.24% | |
| EUR | -0.08% | 0.13% | -0.10% | 0.05% | -0.17% | -0.04% | 0.17% | |
| GBP | -0.22% | -0.15% | -0.24% | -0.08% | -0.29% | -0.17% | 0.02% | |
| CAD | 0.03% | 0.06% | 0.23% | 0.15% | -0.08% | 0.06% | 0.28% | |
| AUD | -0.17% | -0.09% | 0.03% | -0.18% | -0.25% | -0.12% | 0.07% | |
| JPY | 0.07% | 0.16% | 0.30% | 0.06% | 0.20% | 0.12% | 0.33% | |
| NZD | -0.03% | 0.03% | 0.18% | -0.07% | 0.08% | -0.11% | 0.21% | |
| CHF | -0.26% | -0.18% | -0.06% | -0.27% | -0.12% | -0.34% | -0.21% |
The heat map shows percentage changes of major currencies against each other. The base currency is picked from the left column, while the quote currency is picked from the top row. For example, if you pick the Euro from the left column and move along the horizontal line to the Japanese Yen, the percentage change displayed in the box will represent EUR (base)/JPY (quote).
In the meantime, the UK's FTSE 100 Index opened in negative territory on Friday, reflecting the negative impact of the dismal UK data on market mood. Additionally, investors continue to stay away from risk-sensitive assets after news of Evergrande, the second-largest developer in Mainland China, filing for protection from creditors in a US bankruptcy court late Thursday.
Unless there is a noticeable improvement in risk perception in the American session, GBP/USD could stay on the back foot. At the time of press, US stock index futures were down between 0.15% and 0.3%, pointing to a bearish opening in Wall Street. The US economic docket will not feature any macroeconomic data releases on Friday.
GBP/USD Technical Analysis
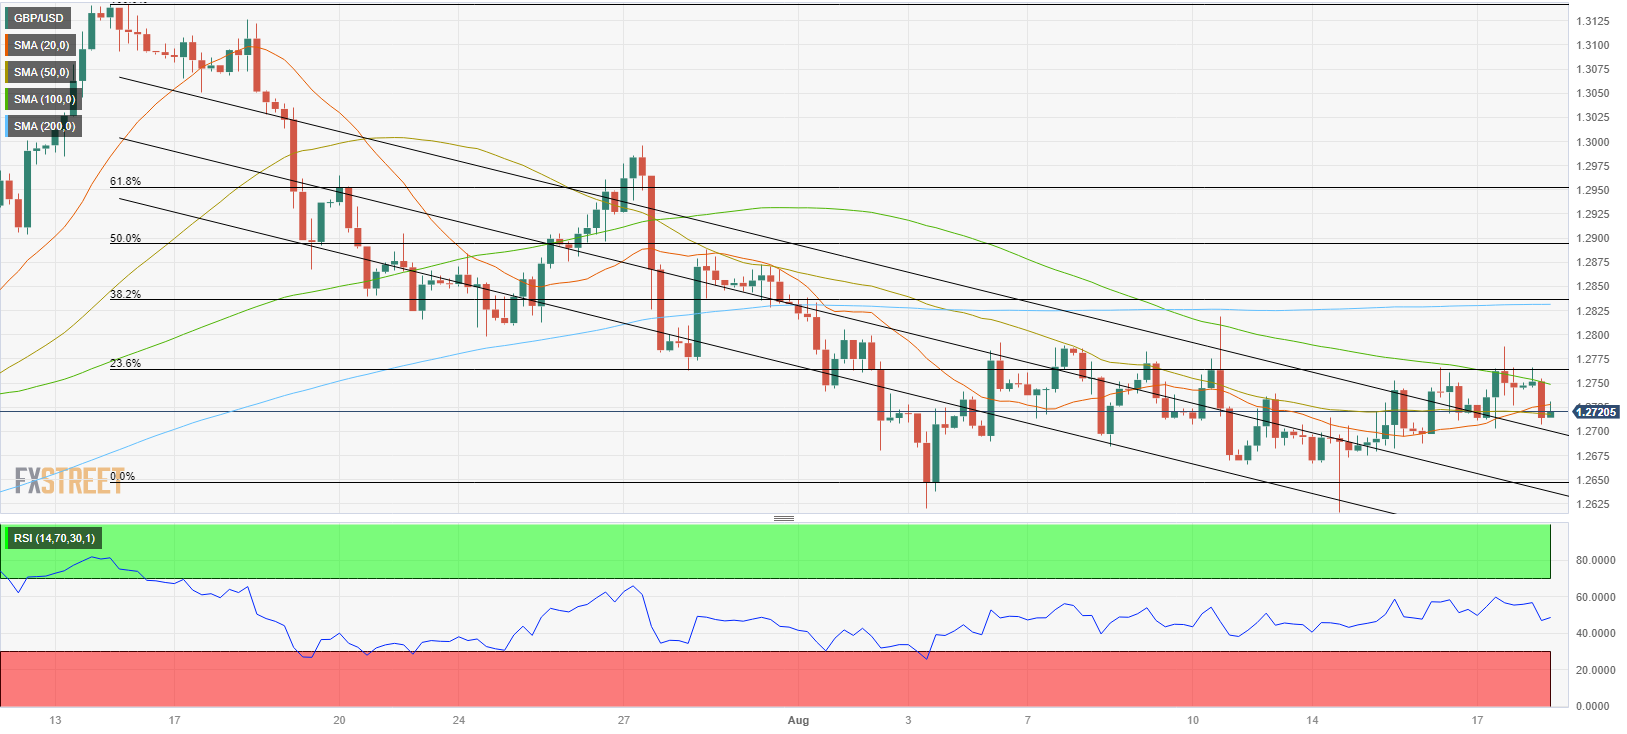
The Relative Strength Index (RSI) indicator on the 4-hour chart retreated to 50, reflecting the loss of bullish momentum. Nevertheless, GBP/USD continues to trade outside the descending regression channel coming from July, possibly discoursing sellers from betting on an extended decline.
1.2700 (psychological level, upper limit of the descending channel) aligns as first support. A 4-hour close below that level could pave the way for another leg lower toward 1.2650 (static level) and 1.2615 (August 15 low, mid-point of the descending channel).
Looking north, the 100-period Simple Moving Average (SMA) forms immediate resistance at 1.2750 before 1.2770 (Fibonacci 23.6% retracement). GBP/USD could regather bullish momentum and target 1.2800 (psychological level) and 1.2830 (Fibonacci 38.2% retracement, 200-period SMA) if it manages to flip 1.2770 into support.
Premium
You have reached your limit of 3 free articles for this month.
Start your subscription and get access to all our original articles.
Author

Eren Sengezer
FXStreet
As an economist at heart, Eren Sengezer specializes in the assessment of the short-term and long-term impacts of macroeconomic data, central bank policies and political developments on financial assets.


