GBP/USD Elliott Wave technical analysis [Video]
![GBP/USD Elliott Wave technical analysis [Video]](https://editorial.fxsstatic.com/images/i/GBPUSD-bearish-object_XtraLarge.png)
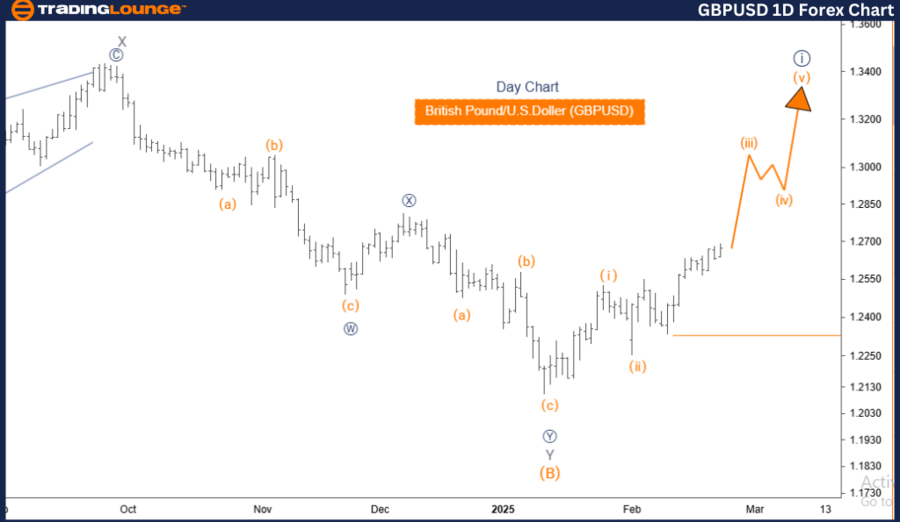
GBPUSD Elliott Wave Analysis – Trading Lounge.
British Pound/ U.S. Dollar (GBPUSD) Day Chart.
GBP/USD Elliott Wave technical analysis
-
Function: Bullish Trend.
-
Mode: Impulsive.
-
Structure: Orange Wave 3.
-
Position: Navy Blue Wave 1.
-
Direction next lower degrees: Orange Wave 2.
-
Wave cancel invalid level: 1.23270.
Analysis details:
The GBPUSD Elliott Wave Analysis for the day chart reflects a bullish trend, with the market currently in an impulsive mode. The structure is identified as Orange Wave 3, which is part of a larger upward movement within Navy Blue Wave 1. This suggests a strong upward phase, characteristic of an impulsive wave structure.
The next lower-degree movement anticipated is Orange Wave 2, expected to follow the completion of Orange Wave 3.
The analysis suggests that Orange Wave 2 has been completed, and the market is now progressing through Orange Wave 3. This wave is expected to show strong upward momentum, consistent with an impulsive trend. Traders should monitor the development of Orange Wave 3, as its completion may indicate the beginning of Orange Wave 2, which would represent a corrective phase with potential pullbacks or consolidation before the trend resumes.
A critical level to watch is the Wave Cancellation Invalid Level at 1.23270. If the price drops below this level, it will invalidate the current wave count, necessitating a reassessment of the market structure. This level serves as a key support, and a breach could signal a potential trend shift or wave structure change.
Summary:
-
GBPUSD is in a bullish trend, with Orange Wave 3 currently in play following the completion of Orange Wave 2.
-
The next expected movement is Orange Wave 2, which may lead to a corrective phase.
-
Key Level to Monitor: 1.23270, as it serves as a crucial threshold for validating the wave count and maintaining the bullish outlook.
-
Understanding wave structures is essential for anticipating potential market movements and aligning trading strategies effectively.
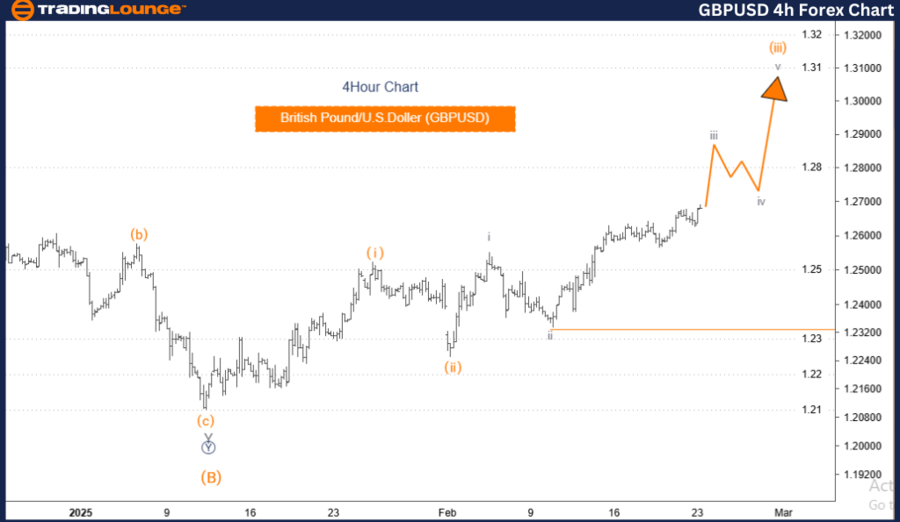
British Pound/ U.S. Dollar (GBPUSD) 4-Hour Chart.
GBP/USD Elliott Wave technical analysis
-
Function: Bullish Trend.
-
Mode: Impulsive.
-
Structure: Gray Wave 3.
-
Position: Orange Wave 3.
-
Direction next lower degrees: Gray Wave 4.
-
Wave cancel invalid level: 1.23270.
Analysis details:
The GBPUSD Elliott Wave Analysis for the 4-hour chart confirms a bullish trend, with the market currently in an impulsive mode. The structure is identified as Gray Wave 3, which is part of a larger upward movement within Orange Wave 3. This indicates that the market is in a strong upward phase, typical of an impulsive wave structure.
The next lower-degree movement anticipated is Gray Wave 4, expected to follow the completion of Gray Wave 3.
The analysis suggests that Gray Wave 2 has been completed, and the market is now progressing through Gray Wave 3. This wave is expected to exhibit strong upward momentum, consistent with an impulsive trend. Traders should monitor the development of Gray Wave 3, as its completion may indicate the beginning of Gray Wave 4, which would represent a corrective phase with potential pullbacks or consolidation before the trend resumes.
A critical level to watch is the Wave Cancellation Invalid Level at 1.23270. If the price drops below this level, it will invalidate the current wave count, necessitating a reassessment of the market structure. This level serves as a key support, and a breach could signal a potential trend shift or wave structure change.
Summary:
-
GBPUSD is in a bullish trend, with Gray Wave 3 currently in play following the completion of Gray Wave 2.
-
The next expected movement is Gray Wave 4, which may lead to a corrective phase.
-
Key Level to Monitor: 1.23270, as it serves as a crucial threshold for validating the wave count and maintaining the bullish outlook.
-
Understanding wave structures is essential for anticipating potential market movements and aligning trading strategies effectively.
Technical analyst: Malik Awais.
GBP/USD Elliott Wave technical analysis [Video]
Author

Peter Mathers
TradingLounge
Peter Mathers started actively trading in 1982. He began his career at Hoei and Shoin, a Japanese futures trading company.


