GBP/USD Elliott Wave technical analysis [Video]
![GBP/USD Elliott Wave technical analysis [Video]](https://editorial.fxstreet.com/images/Markets/Currencies/Majors/GBPUSD/iStock-688526532_XtraLarge.jpg)
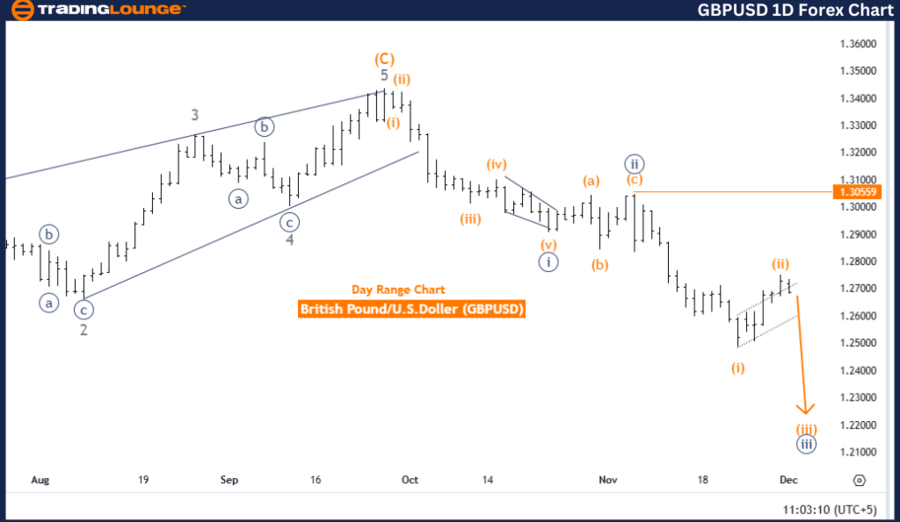
GBP/USD Elliott Wave analysis: Daily chart
GBP/USD Elliott Wave technical analysis
-
Function: Trend.
-
Mode: Impulsive.
-
Structure: Orange Wave 3.
-
Position: Navy Blue Wave 3.
-
Next higher degree direction: Orange Wave 4.
-
Details: Orange wave 2 appears complete, initiating orange wave 3 of navy blue wave 3.
-
Wave cancel invalidation level: 1.30502.
Analysis overview
The analysis of the GBPUSD currency pair applies Elliott Wave theory to the daily chart, revealing an impulsive trend in progress. The current wave structure highlights orange wave 3, which has commenced following the completion of orange wave 2. This setup indicates a continuation of upward momentum.
Key observations
-
Position within the wave cycle:
- The pair is currently within navy blue wave 3, with orange wave 3 actively developing.
- This phase represents a strong bullish progression, characteristic of an impulsive Elliott Wave structure.
-
Future projections:
- Following the expected completion of orange wave 3, the market will likely transition into orange wave 4, which represents a corrective phase within the broader bullish trend.
-
Risk management:
- An invalidation level is set at 1.30502.
- If the price falls to this level, the current Elliott Wave count and the bullish outlook will be invalidated. This serves as a crucial threshold for assessing trend confirmation and managing risk.
Conclusion
The Elliott Wave analysis for GBPUSD on the daily chart suggests a strong impulsive bullish trend, with orange wave 3 of navy blue wave 3 underway. The completion of orange wave 2 marked the beginning of this upward phase.
Key takeaways
- Bullish Trend: As long as the price remains above 1.30502, the bullish outlook remains intact.
- Further Gains Anticipated: Continuation of orange wave 3 signals additional upward movement before transitioning into the corrective orange wave 4 phase.
This analysis provides critical insights into the GBPUSD market, supporting strategic decision-making for trend identification and risk management.
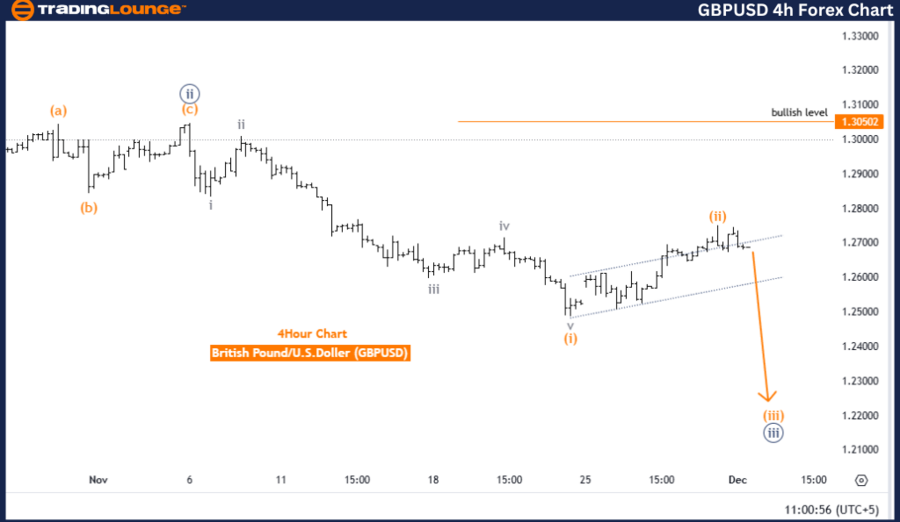
GBP/USD Elliott Wave analysis: Four-hour chart
GBPUSD Elliott Wave technical analysis
-
Function: Trend.
-
Mode: Impulsive.
-
Structure: Orange Wave 3.
-
Position: Navy Blue Wave 3.
-
Next higher degree direction: Orange Wave 4.
-
Details: Orange wave 2 appears complete, initiating orange wave 3 of navy blue wave 3.
-
Wave cancel invalidation level: 1.30502.
Analysis overview
The 4-hour Elliott Wave analysis for GBPUSD demonstrates an impulsive trend in motion. The wave structure highlights orange wave 3, which started following the completion of orange wave 2. This setup points to a continuation of bullish momentum.
Key observations
-
Current Wave Position:
- GBPUSD is situated in navy blue wave 3, with orange wave 3 actively progressing.
- This phase is characterized by a strong impulsive movement, which aligns with the typical dynamics of Elliott Wave analysis.
-
Future Projections:
- After the anticipated conclusion of orange wave 3, the trend is expected to transition into orange wave 4, marking a corrective phase within the broader upward movement.
-
Risk Management:
- The invalidation level for the current wave count is 1.30502.
- A decline to this level would invalidate the current bullish outlook and wave count. This level is critical for trend confirmation and risk assessment.
Conclusion
The Elliott Wave analysis on the 4-hour chart identifies a strong bullish impulsive trend, with orange wave 3 of navy blue wave 3 in progress. The completion of orange wave 2 initiated this upward phase.
Key takeaways
- Bullish Continuation: The bullish outlook remains valid as long as the price stays above 1.30502.
- Further Gains Expected: As orange wave 3 progresses, additional upward momentum is anticipated before the market transitions into the corrective orange wave 4 phase.
This analysis offers actionable insights for identifying trends and managing risk in the GBPUSD market.
GBP/USD Elliott Wave technical analysis [Video]
Author

Peter Mathers
TradingLounge
Peter Mathers started actively trading in 1982. He began his career at Hoei and Shoin, a Japanese futures trading company.


