GBP/USD Elliott Wave technical analysis [Video]
![GBP/USD Elliott Wave technical analysis [Video]](https://editorial.fxstreet.com/images/Markets/Currencies/Majors/GBPUSD/iStock-1178148633_XtraLarge.jpg)
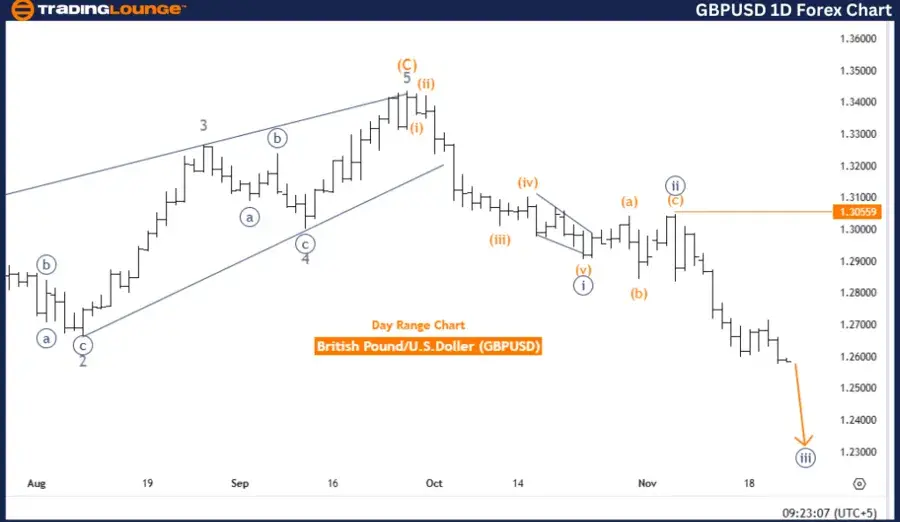
GBPUSD Elliott Wave Analysis Trading Lounge.
British Pound/U.S. Dollar (GBPUSD) Day Chart.
GBP/USD Elliott Wave technical analysis
-
Function: Bearish Trend.
-
Mode: Impulsive.
-
Structure: Navy Blue Wave 3.
-
Position: Gray Wave 1.
-
Direction (next higher degrees): Navy Blue Wave 4.
Details:
The analysis suggests navy blue wave 2 is likely completed, with navy blue wave 3 now in progress.
-
Wave Cancel Invalidation Level: 1.30559.
Market analysis overview
This analysis evaluates the GBPUSD currency pair using Elliott Wave theory on a daily chart, identifying a bearish trend. The market is currently in an impulsive mode, indicating a strong and sustained downward movement.
Key Wave Structure:
-
Primary Wave Structure: Navy Blue Wave 3, which follows the conclusion of navy blue wave 2. This phase marks the onset of a significant bearish trend in the market.
-
Current Position: Gray wave 1 within navy blue wave 3. This represents the early phase of the downward movement in wave 3, with further declines anticipated.
Next anticipated market shift
The market is expected to eventually shift toward navy blue wave 4, a corrective phase likely to follow the completion of wave 3.
Invalidation level
An important invalidation level is set at 1.30559. If the price rises to this level, the current Elliott Wave count and bearish outlook will no longer hold. This threshold is crucial for traders as it provides a reference point for reassessing trading positions and managing risk effectively.
Conclusion
The Elliott Wave analysis indicates GBPUSD is firmly within a bearish phase, driven by the progression of navy blue wave 3.
-
This phase is characterized by a strong downward movement.
-
The completion of navy blue wave 2 aligns with this bearish outlook.
-
The invalidation level of 1.30559 offers a key benchmark for monitoring the trend's validity.
Traders should focus on the continuation of the downward trend while preparing for potential corrective movements as wave 3 completes and transitions toward navy blue wave 4.
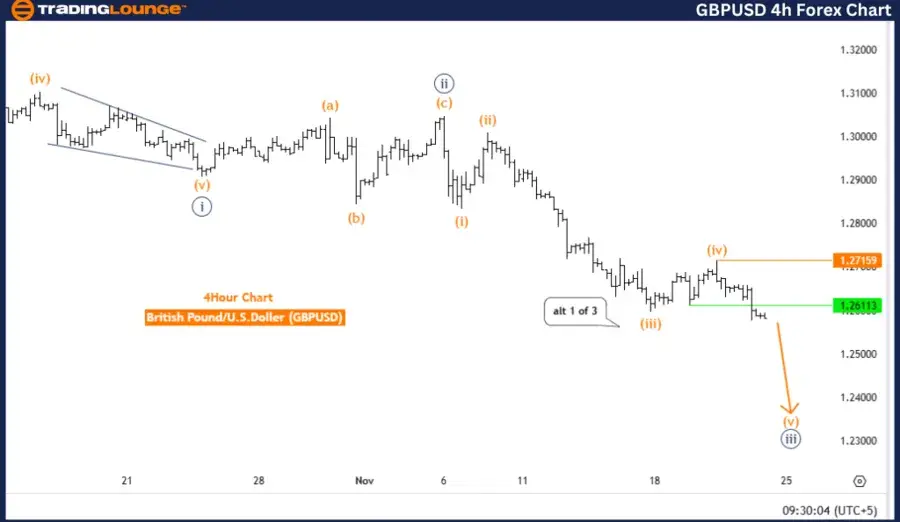
British Pound/U.S. Dollar (GBPUSD) 4-Hour Chart.
GBP/USD Elliott Wave technical analysis
-
Function: Bearish Trend.
-
Mode: Impulsive.
-
Structure: Orange Wave 5.
-
Position: Navy Blue Wave 3.
-
Direction (next higher degrees): Navy Blue Wave 4.
Details:
Orange wave 4 is likely completed, and orange wave 5 of navy blue wave 3 is currently unfolding.
-
Wave Cancel Invalidation Level: 1.27159.
Market analysis overview
This analysis examines the GBPUSD (British Pound/U.S. Dollar) currency pair using Elliott Wave theory on a 4-hour chart, identifying a bearish trend with an impulsive mode.
Key Wave Structure:
-
Current Focus: Orange wave 5, which follows the completion of orange wave 4, is part of the larger navy blue wave 3.
-
Trend Direction: The analysis highlights the final phase of wave 3, where orange wave 5 is expected to drive the price lower before a significant corrective phase occurs.
Next market movements
The bearish trend is anticipated to persist as orange wave 5 progresses, completing the movement of navy blue wave 3. Following this phase, a shift toward navy blue wave 4 (a corrective phase) is expected.
Invalidation level
The invalidation level for the current wave structure is set at 1.27159. If the price rises to this level, the current Elliott Wave count and bearish outlook will no longer be valid. This threshold provides a critical reference point for traders to manage risk effectively.
Conclusion
The Elliott Wave analysis projects that GBPUSD remains in a bearish phase, with orange wave 5 currently unfolding within the larger navy blue wave 3.
-
The trend suggests continued downward movement, aligning with the impulsive nature of the current mode.
-
Traders should monitor price action closely, especially near the invalidation level of 1.27159, to reassess trading positions and strategies.
-
A potential corrective phase is anticipated after the completion of navy blue wave 3.
This analysis underscores the importance of observing wave structures for effective risk management and trading strategies.
Technical analyst: Malik Awais.
GBP/USD Elliott Wave technical analysis [Video]
Author

Peter Mathers
TradingLounge
Peter Mathers started actively trading in 1982. He began his career at Hoei and Shoin, a Japanese futures trading company.


