GBP/USD Elliott Wave technical analysis [Video]
![GBP/USD Elliott Wave technical analysis [Video]](https://editorial.fxstreet.com/images/Markets/Currencies/Majors/GBPUSD/uk-pound-and-united-states-ten-and-twenty-dollar-bills-60942778_XtraLarge.jpg)
GBP/USD Elliott Wave technical analysis
Function: Bullish Trend.
Mode: Impulsive.
Structure: Gray Wave 1.
Position: Orange Wave 3.
Direction next lower degrees: Gray Wave 2.
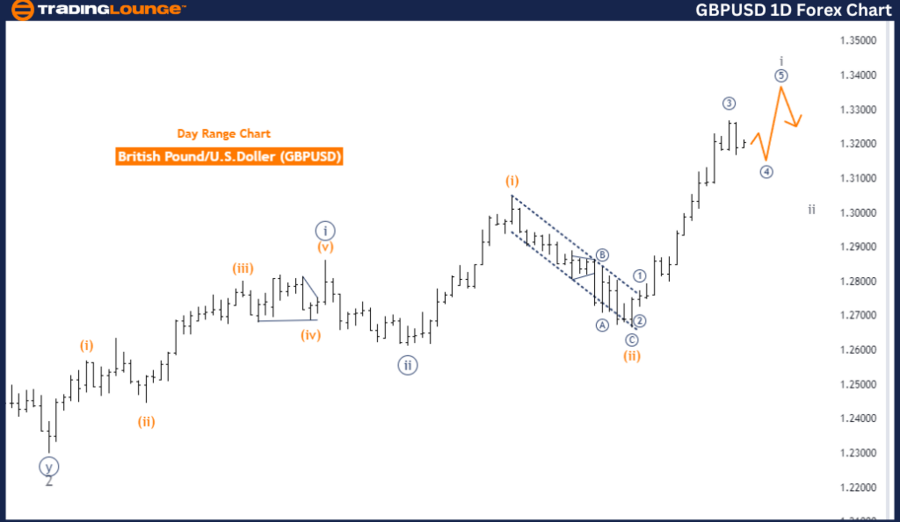
Details: Orange wave 2 of 3 appears to be completed, with gray wave 1 of 3 currently unfolding.
The GBPUSD pair currently demonstrates a bullish trend, as identified through Elliott Wave analysis on the daily chart. The market is in an impulsive phase, reflecting a strong movement aligned with the broader trend. The main structure under observation is gray wave 1, indicating the initiation of a new wave sequence within the overarching trend.
The market’s present position is within orange wave 3, implying that the third wave of the orange degree is underway. This follows the conclusion of orange wave 2, which signals the end of the corrective phase and the continuation of the next impulsive wave.
Looking at the next lower degrees, gray wave 2 is expected to form once the current gray wave 1 is completed. This suggests that following the completion of the ongoing wave, the market may undergo a brief corrective phase before resuming its upward trajectory.
Specifically, orange wave 2 of 3 is now considered complete, shifting the focus to gray wave 1 of 3, which is actively progressing. This signifies that the market has resumed its upward trend and is expected to maintain this direction as the new impulsive wave advances.
In summary, the GBPUSD pair is strongly bullish on the daily chart, with gray wave 1 currently in motion. Following the completion of corrective orange wave 2, the market is advancing in orange wave 3, indicating the continuation of the upward trend. The analysis anticipates that this bullish momentum will likely persist, with a potential brief correction in gray wave 2 after the current wave concludes.
GBP/USD day chart
GBP/USD Elliott Wave technical analysis
Function: Counter Trend.
Mode: Corrective.
Structure: Submicro Navy Blue Wave 4.
Position: Gray Wave 1.
Direction next higher degrees: Submicro Navy Blue Wave 5.
Details: Submicro Navy Blue Wave 3 appears completed, with Submicro Navy Blue Wave 4 now in play.
The GBPUSD pair is currently in a counter trend, as shown by Elliott Wave analysis on the 4-hour chart. This analysis indicates a corrective mode, suggesting that the market is undergoing a temporary pullback or consolidation phase within a larger trend. The primary structure under focus is Submicro Navy Blue Wave 4, a smaller corrective wave within the overall wave sequence.
The market is currently positioned in Gray Wave 1, indicating the beginning of a new sequence. However, the main attention is on Submicro Navy Blue Wave 4, which is actively unfolding. This wave follows the completion of Submicro Navy Blue Wave 3, showing that the market has recently finished an upward move and is now in a corrective phase, possibly preparing for the next wave.
The next higher degree direction points to the formation of Submicro Navy Blue Wave 5, expected to develop after the current corrective wave concludes. This suggests that once Submicro Navy Blue Wave 4 is completed, the market could resume its previous trend with a new impulsive wave, potentially reversing the current correction.
In summary, the GBPUSD pair is in a corrective phase on the 4-hour chart, with Submicro Navy Blue Wave 4 currently progressing. This follows the completion of Submicro Navy Blue Wave 3, and the market is preparing for the possible development of Submicro Navy Blue Wave 5. The analysis indicates that after this corrective phase ends, the market may resume its trend with the next impulsive wave.
GBP/USD four-hour chart
.png.45288449fc658d901abb29496b48c332.png)
GBP/USD Elliott Wave technical analysis [Video]
Author

Peter Mathers
TradingLounge
Peter Mathers started actively trading in 1982. He began his career at Hoei and Shoin, a Japanese futures trading company.


