GBP/USD Elliott Wave technical analysis [Video]
![GBP/USD Elliott Wave technical analysis [Video]](https://editorial.fxstreet.com/images/Markets/Currencies/Majors/GBPUSD/iStock-1151541926_XtraLarge.jpg)
GBP/USD Elliott Wave technical analysis
Function: Counter Trend.
Mode: Corrective.
Structure: Orange Wave 2.
Position: Navy Blue Wave 3.
Direction Next Higher Degrees: Orange Wave 3.
Details: Orange Wave 1 completed, Orange Wave 2 in play.
Wave cancel invalid level: 1.26113.
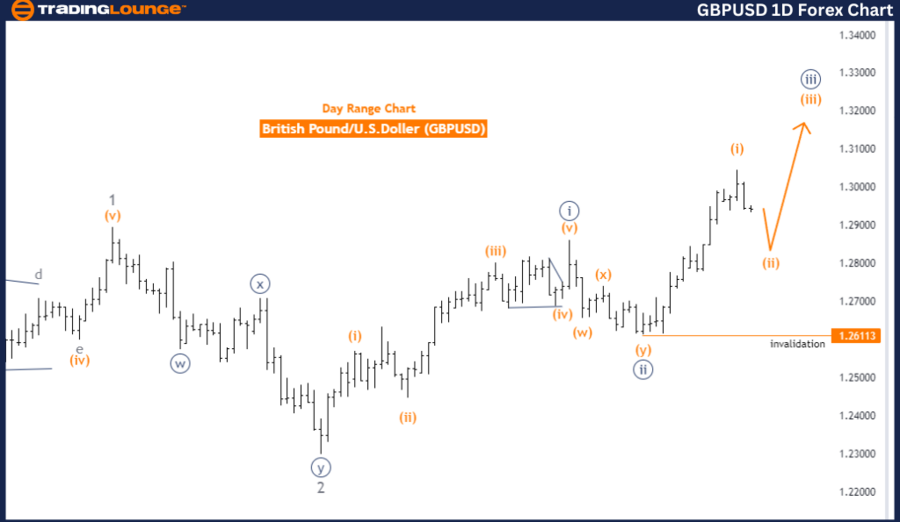
The GBPUSD Elliott Wave Analysis on the daily chart examines the British Pound to U.S. Dollar currency pair using Elliott Wave Theory. This analysis focuses on identifying and interpreting market movements within a counter trend. The mode of the analysis is corrective, indicating that the current wave pattern represents a correction within the larger trend.
The specific wave structure under observation is Orange Wave 2, signifying that the market is in the second wave of an overall corrective pattern. Within this structure, the position is Navy Blue Wave 3, indicating that the currency pair is in the third wave of a smaller degree within the Orange Wave 2.
The analysis anticipates the next higher degree direction to be Orange Wave 3. After the completion of Orange Wave 2, a new impulsive phase, Orange Wave 3, is expected to commence, likely leading to a resumption of the broader trend.
Details provided in the analysis highlight that Orange Wave 1 appears to be completed, and the market is currently progressing through Orange Wave 2. This suggests that the market is undergoing a corrective phase after the completion of the first wave. The current focus is on the development and completion of Orange Wave 2 before transitioning into Orange Wave 3.
A critical aspect of this analysis is the wave cancellation invalid level, set at 1.26113. This level serves as a threshold to validate or invalidate the current wave analysis. If the market price surpasses this level, it would invalidate the current wave analysis, requiring a reassessment of the wave structure. This invalidation level is essential for maintaining the accuracy of the wave analysis and ensuring effective risk management.
In summary, the GBPUSD daily chart analysis identifies the market within a corrective counter trend, focusing on the development of Orange Wave 2 within Navy Blue Wave 3. The analysis suggests that Orange Wave 1 is completed, and the market is now in Orange Wave 2. The next anticipated phase is Orange Wave 3. The wave cancellation invalid level at 1.26113 is crucial for validating the current wave count and maintaining risk management.
GBP/USD Elliott Wave analysis: Day chart
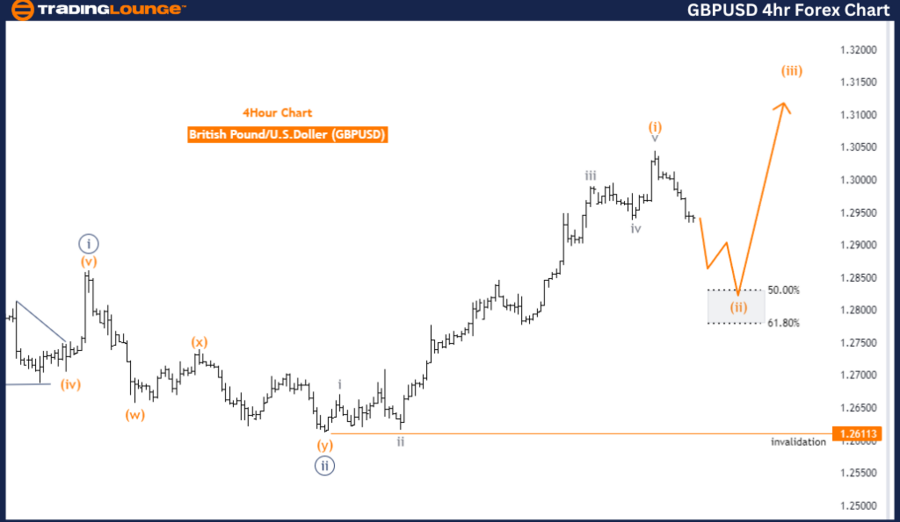
GBP/USD Elliott Wave analysis: Four-hour chart
Function: Counter Trend.
Mode: Corrective.
Structure: Orange Wave 2.
Position: Navy Blue Wave 3.
Direction next higher degrees: Orange Wave 3.
Details: Orange Wave 1 completed, Orange Wave 2 in play.
Wave cancel invalid level: 1.26113.
The GBPUSD Elliott Wave Analysis on the 4-hour chart examines the British Pound to U.S. Dollar currency pair using Elliott Wave Theory. This analysis aims to identify and interpret market movements within a counter trend. The mode of the analysis is corrective, indicating that the current wave pattern is a correction within the broader trend.
The specific wave structure under observation is Orange Wave 2. This indicates that the market is currently in the second wave of an overall corrective pattern. Within this structure, the position is Navy Blue Wave 3, suggesting that the currency pair is in the third wave of a smaller degree within the Orange Wave 2.
The analysis anticipates the next higher degree direction to be Orange Wave 3. After the completion of Orange Wave 2, a new impulsive phase, Orange Wave 3, is expected to commence. This would likely lead to a resumption of the broader trend.
Details provided in the analysis highlight that Orange Wave 1 appears to be completed, and the market is currently progressing through Orange Wave 2. This suggests that the market is undergoing a corrective phase after the completion of the first wave. The current focus is on the development and completion of Orange Wave 2 before transitioning into Orange Wave 3.
A critical component of this analysis is the wave cancel invalid level, set at 1.26113. This level serves as a threshold to validate or invalidate the current wave count. If the market price surpasses this level, it would invalidate the current wave analysis, requiring a reassessment of the wave structure. This invalidation level is essential for maintaining the accuracy of the wave analysis and ensuring effective risk management.
In summary, the GBPUSD 4-hour chart analysis identifies the market within a corrective counter trend, focusing on the development of Orange Wave 2 within Navy Blue Wave 3. The analysis suggests that Orange Wave 1 is completed, and the market is now in Orange Wave 2. The next anticipated phase is Orange Wave 3. The wave cancellation invalid level at 1.26113 is crucial for validating the current wave count and maintaining risk management.
GBP/USD Elliott Wave technical analysis [Video]
Author

Peter Mathers
TradingLounge
Peter Mathers started actively trading in 1982. He began his career at Hoei and Shoin, a Japanese futures trading company.


