GBP/USD Elliott Wave technical analysis [Video]
![GBP/USD Elliott Wave technical analysis [Video]](https://editorial.fxstreet.com/images/Markets/Currencies/Majors/GBPUSD/iStock-1078115946_XtraLarge.jpg)
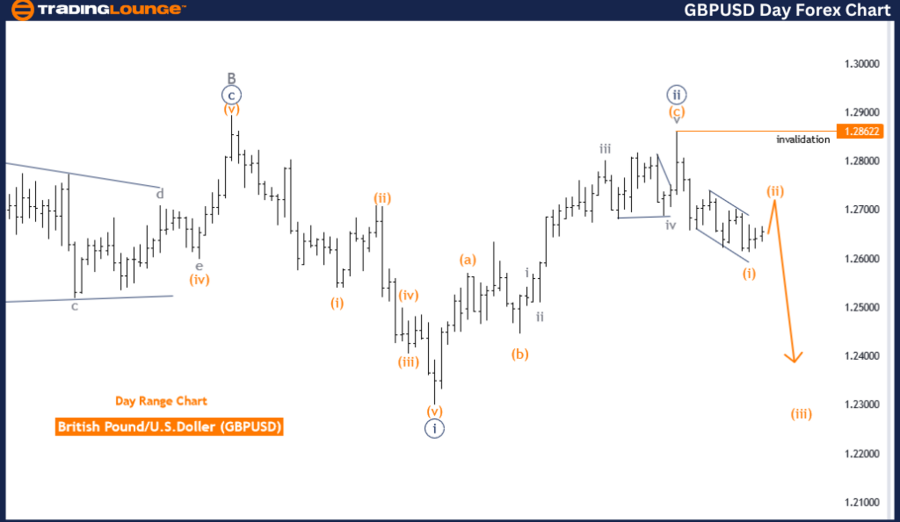
GBPUSD Elliott Wave Analysis Trading Lounge Day Chart.
GBP/USD Elliott Wave technical analysis
Function: Trend.
Mode: Corrective.
Structure: Orange wave 2.
Position: Navy blue wave 3.
Next lower degrees direction: Orange wave 3.
Invalid level: 1.28622.
The GBPUSD Elliott Wave analysis on the daily chart provides insight into market movements and projections using Elliott Wave Theory. Here's a breakdown:
-
Function: The market is in a trend, indicating directional movement rather than random or sideways patterns.
-
Mode: The market is currently in a corrective phase, moving against the larger trend. This suggests a temporary pause or pullback, indicating consolidation before resuming the primary direction.
-
Structure: The market is in orange wave 2, a retracement phase following an impulsive wave. This wave is part of a larger cycle, indicating a pullback from the previous trend.
-
Position: The market is in navy blue wave 3, typically the most powerful and extended wave in Elliott Wave Theory.
Next lower degrees direction
After completing the current corrective phase (orange wave 2), the market is expected to enter an impulsive phase (orange wave 3), suggesting potential upward movement.
Details
-
Orange wave 1 appears completed, marking the end of the initial move in the current trend phase.
-
The market is now in the corrective phase of orange wave 2, representing a pullback or consolidation period before resuming the larger trend direction with orange wave 3.
Wave cancellation invalid level: The wave cancellation invalid level is set at 1.28622. If the market moves below this point, the current wave count would be invalidated, requiring a reassessment of the wave structure.
Summary: The GBPUSD daily chart analysis shows the market in a corrective trend phase within orange wave 2, positioned in navy blue wave 3. The next lower degrees direction points to an upcoming impulsive phase, orange wave 3. The market has completed orange wave 1 and is currently in orange wave 2, with a crucial invalidation level at 1.28622.
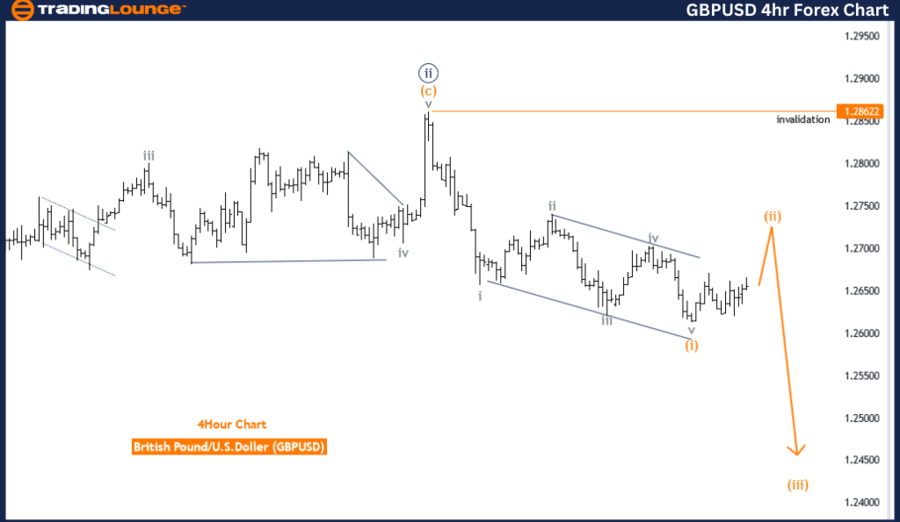
GBP/USD four-hour chart analysis
Function: Trend.
Mode: Corrective.
Structure: Orange wave 2.
Position: Navy blue wave 3.
Next lower degrees direction: Orange wave 3.
Invalid level: 1.28622
The GBPUSD Elliott Wave analysis on the 4-hour chart provides insights into the market conditions using Elliott Wave Theory. Here's a detailed breakdown:
-
Function: The market is in a trend, suggesting a specific directional movement rather than random fluctuations or sideways patterns.
-
Mode: The market is in a corrective phase, indicating a temporary pause or pullback within the larger trend. This phase typically precedes the resumption of the primary market direction.
-
Structure: The market is in orange wave 2, a retracement phase within the larger Elliott Wave cycle. This phase follows the completion of the previous impulsive wave.
-
Position: The market is currently in navy blue wave 3, which is part of the larger trend cycle and usually the most powerful wave in Elliott Wave Theory.
Next lower degrees direction
The analysis points to orange wave 3 as the next phase. After completing the current corrective phase (orange wave 2), the market is expected to enter an impulsive phase (orange wave 3), suggesting potential upward movement.
Details
- Orange wave 1 appears completed, marking the end of the initial move in the current trend phase.
- The market is now in orange wave 2, a corrective pullback phase before potentially resuming the larger trend direction with orange wave 3.
Wave cancellation invalid level: The wave cancellation invalid level is set at 1.28622. If the market falls below this level, the current wave count would be invalidated, necessitating a reassessment of the wave structure.
Summary: The GBPUSD 4-hour chart analysis shows the market in a corrective trend phase within orange wave 2, positioned in navy blue wave 3. The next lower degrees direction suggests an upcoming impulsive phase, orange wave 3. The market has completed orange wave 1 and is now experiencing orange wave 2, with a critical invalidation level at 1.28622.
GBP/USD Elliott Wave technical analysis [Video]
Author

Peter Mathers
TradingLounge
Peter Mathers started actively trading in 1982. He began his career at Hoei and Shoin, a Japanese futures trading company.


