GBP/USD Elliott Wave technical analysis [Video]
![GBP/USD Elliott Wave technical analysis [Video]](https://editorial.fxstreet.com/images/Markets/Currencies/Majors/GBPUSD/new-style-twenty-pound-notes-3079195_XtraLarge.jpg)
GBP/USD Elliott Wave technical analysis
Function: Trend.
Mode: Corrective.
Structure: Orange wave C.
Position: Navy blue wave 2.
Direction next higher degrees: Navy blue wave 3.
Details: orange wave B looking completed, now orange wave C of 2 is in play.
Wave cancel invalid level: 1.23023.
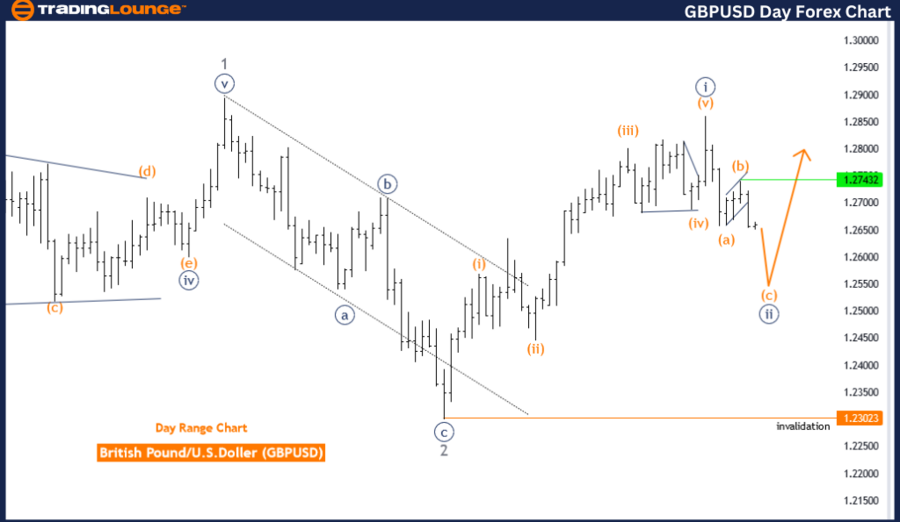
The GBPUSD Elliott Wave analysis on the daily chart examines the ongoing market trend through the lens of Elliott Wave theory, specifically focusing on a corrective phase. This analysis centers on the orange wave C within the broader structure of navy blue wave 2. The primary objective is to track and predict the market's movements during this corrective period.
In Elliott Wave terms, a corrective mode represents a temporary deviation from the main trend, characterized by retracement or consolidation phases. Here, the structure being analyzed is the orange wave C, which is part of the larger corrective navy blue wave 2. The anticipated direction for the next higher degrees is navy blue wave 3, suggesting an upward trend continuation once the corrective phase concludes.
The detailed analysis indicates that orange wave B appears to be completed, signaling a transition to orange wave C of navy blue wave 2. This suggests that while the market is still within the corrective phase, it is progressing towards the end of this phase. The completion of orange wave B means the market is now experiencing orange wave C, which is a crucial part of the overall corrective pattern.
A significant aspect of this analysis is the wave cancel invalid level, set at 1.23023. This level is pivotal for confirming the current wave count and maintaining the integrity of the Elliott Wave structure. If the market price moves below this level, it would invalidate the current wave analysis, prompting a re-evaluation and possibly altering the market outlook.
In summary, the GBPUSD daily chart analysis indicates that the market is navigating through a corrective phase, specifically within orange wave C of navy blue wave 2. The completion of orange wave B suggests that the market is progressing towards the final stages of this corrective phase. The wave cancel invalid level at 1.23023 is critical for validating the current wave structure, guiding future market expectations, and ensuring the accuracy of the Elliott Wave analysis.
GBP/USD day chart
GBP/USD four-hour chart
Function: Trend.
Mode: Corrective.
Structure: Orange wave C.
Position: Navy blue wave 2.
Direction next higher degrees: Navy blue wave 3.
Details: orange wave B looking completed, now orange wave C of 2 is in play.
Wave cancel invalid level: 1.23023.
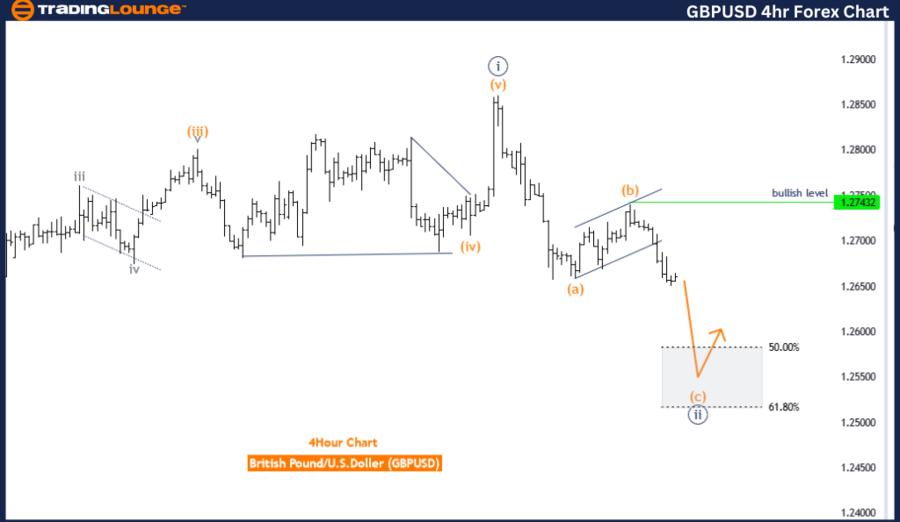
The GBPUSD Elliott Wave analysis on the 4-hour chart provides insights into the current market trend using the Elliott Wave theory, highlighting a corrective mode within the larger trend structure. This analysis focuses on the orange wave C, positioned within the navy blue wave 2. The primary function of this analysis is to understand and predict the ongoing trend movements.
In the context of Elliott Wave theory, a corrective mode indicates a temporary counter-trend movement that interrupts the primary trend direction. Here, the structure being analyzed is orange wave C, which is part of the larger navy blue wave 2. The overall trend direction for the next higher degrees is identified as navy blue wave 3, indicating that after the completion of the current corrective phase, the market is expected to resume its upward movement.
The details of the analysis reveal that orange wave B appears to be completed, and the market is now navigating through orange wave C of navy blue wave 2. This suggests that the market is still within the corrective phase, but the completion of orange wave B indicates progress towards the end of this phase. Once orange wave C concludes, the market is expected to transition into the next impulsive phase, navy blue wave 3, resuming the upward trend.
A critical aspect of this analysis is the wave cancel invalid level, set at 1.23023. This level serves as a crucial benchmark for confirming the current wave structure. If the market price falls below this level, it would invalidate the existing wave count, necessitating a re-evaluation of the Elliott Wave analysis and potentially altering the market outlook.
In summary, the GBPUSD 4-hour chart analysis indicates that the market is in a corrective phase within orange wave C, part of the larger navy blue wave 2. The completion of orange wave B suggests progress towards the end of the corrective phase, with the market currently in orange wave C of navy blue wave 2. The wave cancel invalid level at 1.23023 is crucial for validating the current wave count and guiding future market expectations based on Elliott Wave principles.
GBP/USD Elliott Wave technical analysis [Video]
Author

Peter Mathers
TradingLounge
Peter Mathers started actively trading in 1982. He began his career at Hoei and Shoin, a Japanese futures trading company.


