GBP/USD Elliott Wave technical analysis [Video]
![GBP/USD Elliott Wave technical analysis [Video]](https://editorial.fxstreet.com/images/Markets/Currencies/Majors/GBPUSD/iStock-1088749732_XtraLarge.jpg)
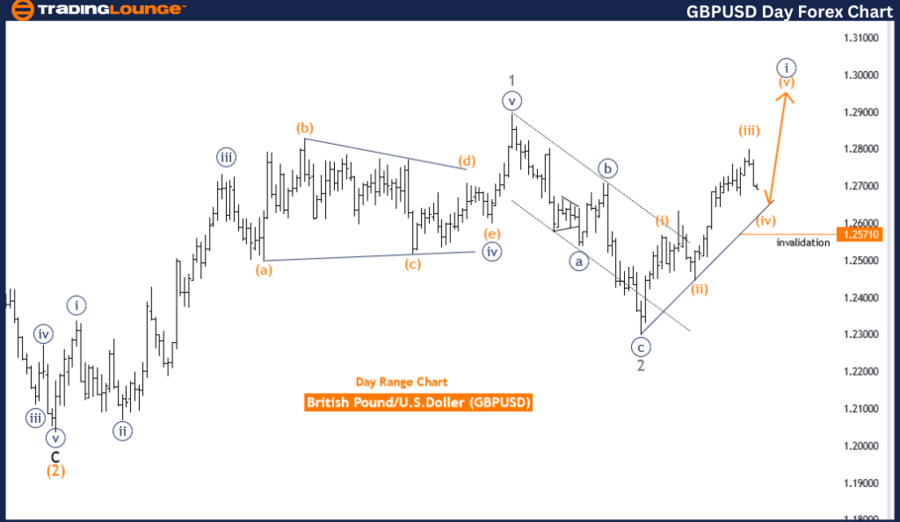
GBPUSD Elliott Wave Analysis Trading Lounge Day Chart.
GBP/USD Elliott Wave technical analysis
Function: Trend.
Mode: Impulsive.
Structure: Orange wave 4.
Position: Navy blue wave 1.
Direction next higher degrees: Orange wave 5
Details: Orange wave 3 looking completed.
Now orange wave 4 is in play and looking near to end.
Wave cancel invalid level:1.25707
The GBPUSD Elliott Wave Analysis on the daily chart evaluates the price action of the British Pound against the U.S. Dollar using Elliott Wave Theory. This technical analysis is focused on the trend function, indicating that the market is following a specific directional movement. The mode of this trend is classified as impulsive, suggesting strong directional momentum rather than a corrective or sideways movement.
The primary wave structure being examined is orange wave 4, which is part of a larger sequence identified as navy blue wave 1. This classification implies that the market is undergoing an impulsive phase within the initial stage of a larger upward movement. The position of the market within navy blue wave 1 indicates that the current orange wave 4 is a corrective phase within this larger impulsive trend.
The analysis anticipates the next movement in the higher degrees to be orange wave 5. This expectation suggests that after the completion of the current orange wave 4, the market is likely to resume its upward trajectory with the initiation of orange wave 5. This provides traders with a forward-looking perspective on the continuation of the broader trend once the current corrective phase concludes.
A significant detail in this analysis is that orange wave 3 is considered complete. The market is currently in orange wave 4, which is nearing its end. The wave cancel invalid level is set at 1.25707, serving as a crucial threshold. If the market price falls to or below this level, the current wave count would be invalidated, necessitating a reassessment of the wave structure and potentially altering trading strategies.
In summary, the GBPUSD Elliott Wave Analysis on the daily chart indicates that the market is in an impulsive trend phase within the context of a larger upward movement. The market is in orange wave 4 of navy blue wave 1, with the next anticipated movement being orange wave 5.
The completion of orange wave 3 indicates that the current corrective wave 4 is approaching its end. The invalidation level at 1.25707 is critical for maintaining the integrity of this wave count. This analysis aids traders in understanding market dynamics and refining their strategies based on Elliott Wave patterns, anticipating both trend continuation and potential corrective phases.
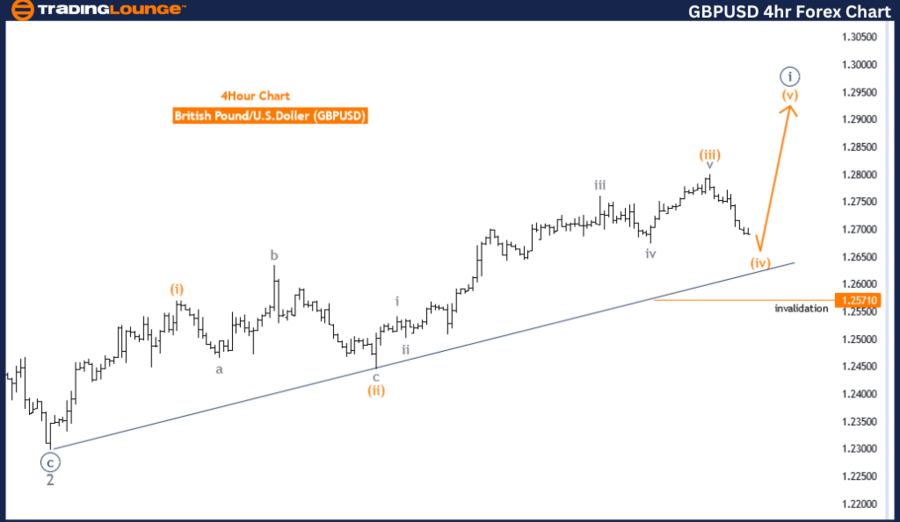
GBP/USD Elliott Wave technical analysis four-hour chart
Function: Trend
Mode: Corrective
Structure: Orange wave 4
Position: Navy blue wave 1
Direction next higher degrees: Orange wave 5
Details: Orange wave 3 looking completed.
Now orange wave 4 is in play and looking near to end.
Wave cancel invalid level: 1.25707
The GBPUSD Elliott Wave Analysis on the 4-hour chart examines the price movements of the British Pound against the U.S. Dollar using the Elliott Wave Theory. This analysis is categorized under the trend function, suggesting that the market is currently following a specific directional pattern. The mode of this trend is identified as corrective, indicating that the market is undergoing a retracement or consolidation phase rather than a strong directional move.
The primary wave structure being analyzed is orange wave 4, which is a part of the larger sequence identified as navy blue wave 1. This classification highlights that the market is in a corrective phase within a larger upward movement. The position of the market within navy blue wave 1 suggests that the current corrective phase is a part of the initial stage of a larger bullish trend.
The next anticipated movement in the higher degrees is orange wave 5. This indicates that after the completion of the current orange wave 4, the market is expected to resume its upward trend with the commencement of orange wave 5. This future wave provides traders with an outlook on the continuation of the broader trend once the corrective phase concludes.
A critical detail in this analysis is that orange wave 3 is considered complete. The market is now in the midst of orange wave 4, which is currently in play and approaching its end. The wave cancel invalid level is set at 1.25707, which serves as a crucial threshold. If the market price falls to or below this level, the current wave count would be invalidated, necessitating a reassessment of the wave structure and potentially altering trading strategies.
In summary, the GBPUSD Elliott Wave Analysis on the 4-hour chart suggests that the market is in a corrective phase within the context of a larger upward trend. The market is currently in orange wave 4 of navy blue wave 1, with the next anticipated movement being orange wave 5. The completion of orange wave 3 indicates that the corrective wave 4 is nearing its end. The invalidation level at 1.25707 is critical for maintaining the integrity of this wave count. This analysis helps traders understand market movements and refine their strategies based on the Elliott Wave patterns, anticipating both the continuation of the trend and potential corrective phases.
GBP/USD Elliott Wave technical analysis [Video]
Author

Peter Mathers
TradingLounge
Peter Mathers started actively trading in 1982. He began his career at Hoei and Shoin, a Japanese futures trading company.


