GBP/USD Elliott Wave technical analysis [Video]
![GBP/USD Elliott Wave technical analysis [Video]](https://editorial.fxstreet.com/images/Markets/Currencies/Majors/GBPUSD/iStock-472155766_XtraLarge.jpg)
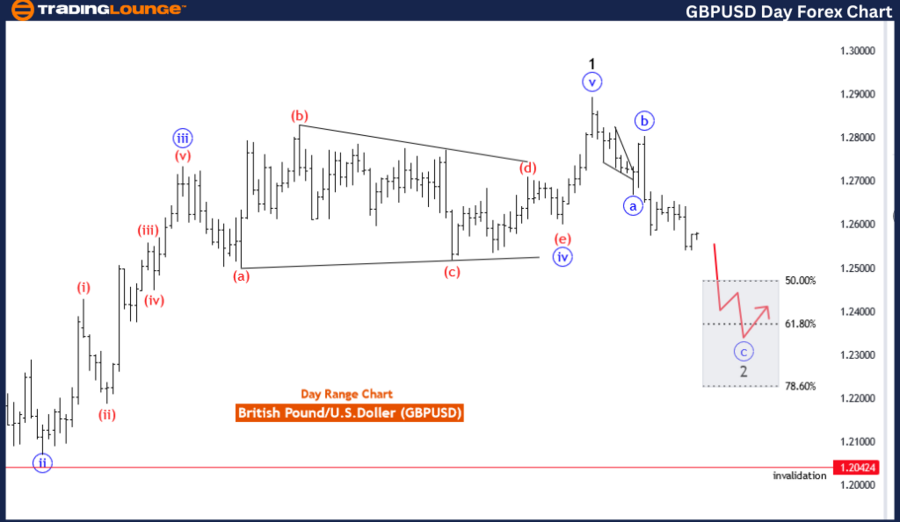
GBP/USD Elliott Wave technical analysis
Function: Counter Trend.
Mode: Corrective.
Structure: Blue wave C.
Position: Black wave 2.
Direction next higher degrees: Black wave 3.
Details: Blue wave B of 2 completed at 1.28041, now blue wave C 2 of is in play. Wave Cancel invalid level: 1.20424.
The GBPUSD Elliott Wave Analysis for the day chart provides traders with insights into potential price movements of the British Pound against the US Dollar, utilizing Elliott Wave principles for technical analysis.
Identified as a "Counter Trend" scenario, the analysis suggests that the current market direction opposes the prevailing trend, indicating a potential reversal or corrective movement against the broader price trend. Traders may expect a temporary deviation from the primary trend before a potential resumption or continuation.
Described as "Corrective" in mode, the analysis indicates that the current market movement is part of a corrective phase within the broader Elliott Wave cycle. This suggests that the current movement is corrective in nature and may not necessarily signal a reversal of the overall trend but rather a temporary pause or retracement.
The "STRUCTURE" is identified as "blue wave C," providing clarity on the current wave count within the corrective phase. This aids traders in understanding the ongoing corrective pattern and its relation to the broader Elliott Wave structure.
Positioned as "black wave 2," the analysis highlights the current wave count within the broader Elliott Wave cycle, indicating the specific phase of the correction within the larger wave structure. This suggests that the market is currently undergoing a correction after completing a larger degree wave.
The "DIRECTION NEXT HIGHER DEGREES" is stated as "black wave 3," suggesting the anticipated direction for the subsequent higher-degree wave. This implies that once the current corrective phase completes, the market may resume its upward movement within the broader Elliott Wave structure.
In the "DETAILS" section, it is noted that "blue wave B of 2 completed at 1.28041, now blue wave C of 2 is in play." This indicates that the current corrective phase is ongoing, with the expectation of completion before a potential resumption of the broader trend.
In summary, the GBPUSD Elliott Wave Analysis for the day chart offers traders valuable insights into potential corrective movements, critical levels to monitor, and the anticipated direction within the broader Elliott Wave structure, aiding in informed trading decisions.
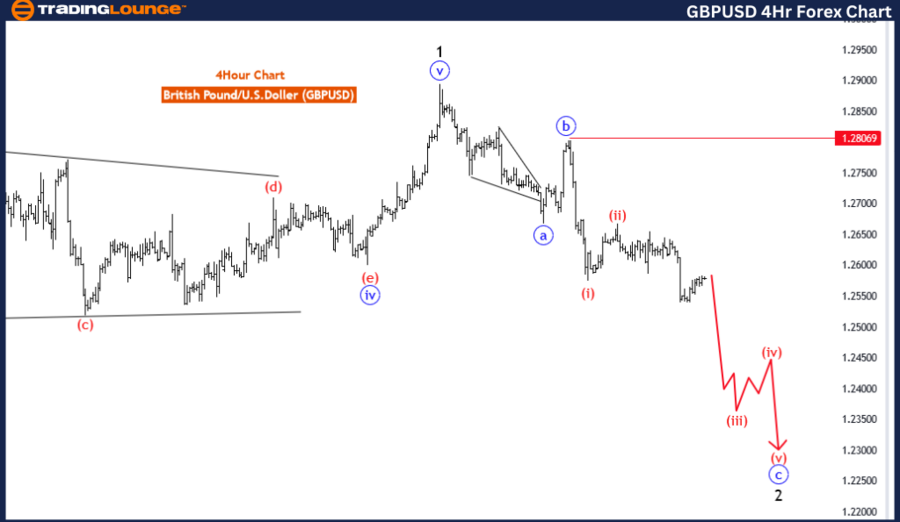
GBP/USD four-hour chart
Function: Counter Trend.
Mode: impulsive as C.
Structure: Red wave 3.
Position: blue wave C.
Direction next higher degrees: Red wave 4.
Details: Red wave 2 completed at 1.26676, now red wave 3 of C is in play. Wave Cancel invalid level: 1.28069.
The GBPUSD Elliott Wave Analysis for the 4-hour chart provides insights into potential price movements of the British Pound against the US Dollar, utilizing Elliott Wave principles for technical analysis.
Identified as a "Counter Trend" scenario, the analysis suggests that the current market direction opposes the prevailing trend, indicating a potential reversal or corrective movement against the broader price trend. Traders may anticipate a temporary deviation from the primary trend before a potential resumption or continuation.
Described as "impulsive as C" in mode, the analysis indicates that the current market movement exhibits characteristics of impulsive price action within the corrective phase. This implies that the corrective movement is unfolding in a rapid and directional manner, potentially leading to significant price changes.
The "STRUCTURE" is identified as "red wave 3," providing clarity on the current wave count within the Elliott Wave cycle. This aids traders in understanding the ongoing corrective pattern and its relation to the broader Elliott Wave structure.
Positioned as "blue wave C," the analysis highlights the current wave count within the corrective phase, indicating the specific phase of the correction within the broader Elliott
Wave cycle. This suggests that the market is currently undergoing a correction before potentially resuming its downward movement.
The "DIRECTION NEXT HIGHER DEGREES" is stated as "red wave 4," suggesting the anticipated direction for the subsequent higher-degree wave. This implies that once the current corrective phase completes, the market may resume its downward movement within the broader Elliott Wave structure.
In the "DETAILS" section, it is noted that "red wave 2 completed at 1.26676, now red wave 3 of C is in play." This indicates that the current corrective phase is ongoing, with the expectation of completion before a potential resumption of the broader trend.
In summary, the GBPUSD Elliott Wave Analysis for the 4-hour chart offers traders valuable insights into potential corrective movements, critical levels to monitor, and the anticipated direction within the broader Elliott Wave structure, aiding in informed trading decisions.
GBP/USD Elliott Wave technical analysis [Video]
Author

Peter Mathers
TradingLounge
Peter Mathers started actively trading in 1982. He began his career at Hoei and Shoin, a Japanese futures trading company.


