|

GBP/USD bulls regain control and aim at 1.3040 and 1.3150

GBPUSD

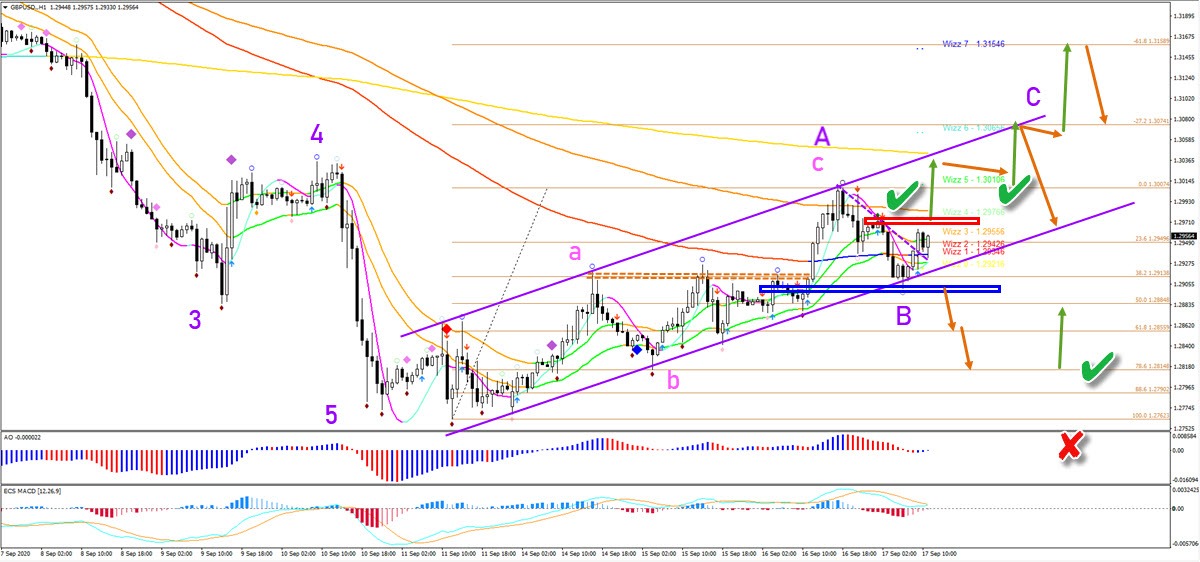
The GBP/USD is building a well balanced uptrend channel. The bulls took over control when price broke through the resistance zone (dotted orange) and 144 ema. But can they push price action up higher?

GBPUSD

Price Charts and Technical Analysis

The GBP/USD have the upper hand at the moment. And they are expected to keep it. A break above the resistance Fractal (red box) confirms the uptrend continuation. The main target is the long-term moving average and 38.2% Fibonacci retracement level of the 4 hour chart at 1.3040.

But price action could extend to higher levels. Especially if price action is able to show a bull flag pattern. Then the next breakout could take price to the -27.2% Fibonacci target and the Wizz 6 level. A break above that could even create an impulse towards the -61.8% Fibonacci target and Wizz 7 level at around 1.3150, which is where a larger retracement could take place.

The downside is only likely if price is able to break below the broken tops and support Fractals (blue box). The main target is then the 78.63% Fib level, which could easily be a bouncing spot. Only a break below the 100% Fib invalidates the bullish outlook. For the moment, the wave patterns suggest a completed ABC (pink) within wave A (purple) and a current wave B-C (purple) pattern.

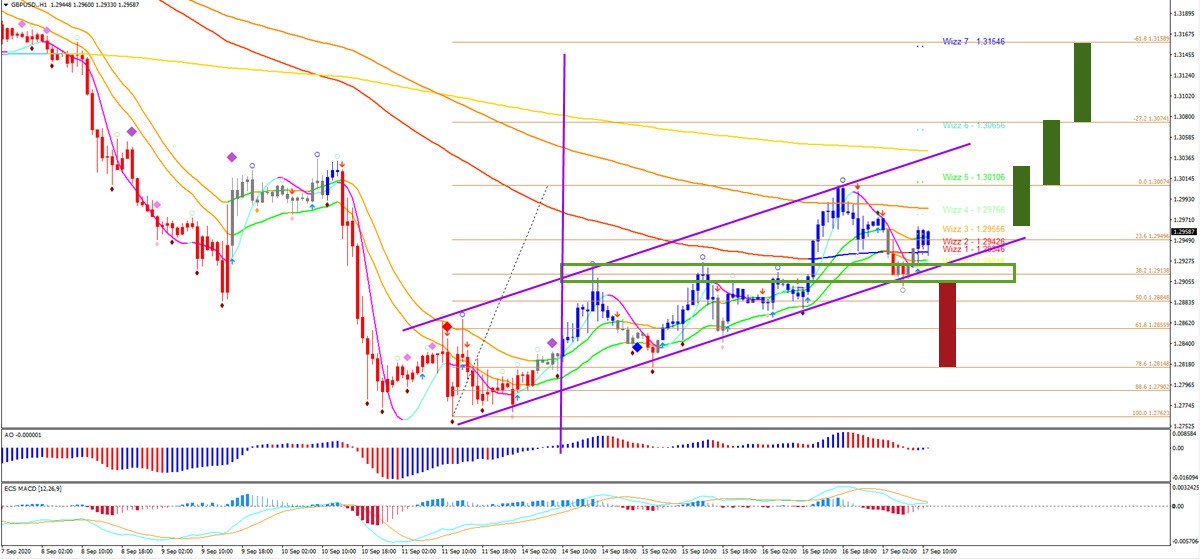
Our own Elliott Wave software (see image below) already confirmed the bullish trend since the purple vertical line. The broken Fractals were a key confirmation of the upside (blue box). Now there seems to be more space to the upside (green boxes) than downside (red boxes - boxes were manually added in the image).

GBPUSD

The analysis has been done with the ecs.SWAT method and ebook.

Author

Chris Svorcik

Chris Svorcik

Elite CurrenSea

Experience Chris Svorcik has co-founded Elite CurrenSea in 2014 together with Nenad Kerkez, aka Tarantula FX. Chris is a technical analyst, wave analyst, trader, writer, educator, webinar speaker, and seminar speaker of the financial markets.

More from Chris Svorcik
Share:

Editor's Picks

EUR/USD recedes to daily lows near 1.1850

EUR/USD keeps its bearish momentum well in place, slipping back to the area of 1.1850 to hit daily lows on Monday. The pair’s continuation of the leg lower comes amid decent gains in the US Dollar in a context of scarce volatility and thin trade conditions due to the inactivity in the US markets.

GBP/USD resumes the downtrend, back to the low-1.3600s

GBP/USD rapidly leaves behind Friday’s decent advance, refocusing on the downside and retreating to the 1.3630 region at the beginning of the week. In the meantime, the British Pound is expected to remain under the microscope ahead of the release of the key UK labour market report on Tuesday.

Gold looks inconclusive around $5,000

Gold partially fades Friday’s strong recovery, orbiting around the key $5,000 region per troy ounce in a context of humble gains in the Greenback on Monday. Additing to the vacillating mood, trade conditions remain thin amid the observance of the Presidents Day holiday in the US.

Bitcoin consolidates as on-chain data show mixed signals

Bitcoin price has consolidated between $65,700 and $72,000 over the past nine days, with no clear directional bias. US-listed spot ETFs recorded a $359.91 million weekly outflow, marking the fourth consecutive week of withdrawals.

The week ahead: Key inflation readings and why the AI trade could be overdone

It is likely to be a quiet start to the week, with US markets closed on Monday for Presidents Day. European markets are higher across the board and gold is clinging to the $5,000 level after the tamer than expected CPI report in the US reduced haven flows to precious metals.

XRP steadies in narrow range as fund inflows, futures interest rise

Ripple is trading in a narrow range between $1.45 (immediate support) and $1.50 (resistance) at the time of writing on Monday. The remittance token extended its recovery last week, peaking at $1.67 on Sunday from the weekly open at $1.43.