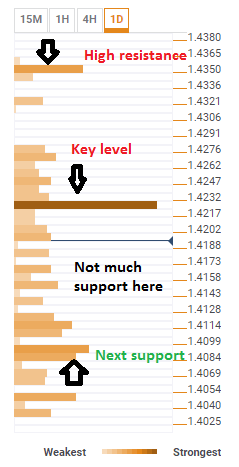
GBP/USD broke down through a key level, little support below — Confluence Detector


The Technical Confluences Indicator shows that the breakdown of GBP/USD below the $1.4220 region probably needed a lot of momentum. This is a cluster of many technical lines and the move to the downside opens the door to further losses. The $1.4220 level is the meeting point of the Bolinger Band 1h-Middle Stdv, the Bolinger Band 15m-Middle Stdv, the SMA50-15m, the SMA10-1h, the Fibo 23.6% 1d, the SMA-5-15m, a month high, one week high, the SMA100-15m, a 4h high and the SMA10-15m. 

Undoubtedly, it is a very significant line and the move below this area is quite significant

While there are quite a few levels worth mentioning on the way down, the only significant confluence of technical levels awaits at $1.4090, the meeting point of the Pivot Point 1d S2, the Fibo 61.8% 1month, and later, the SMA50-4h and the Bolinger Band Stdv.

On the topside, the pair has serious resistance only around $1.4342, the 52 weeks high. In general, the pair had to choose where to go around $1.4220 and decided to go down.

GBPUSD confluence March 27 2018

Confluence Detector

The Confluence Detector finds exciting opportunities using Technical Confluences. The TC is a tool to locate and point out those price levels where there is a congestion of indicators, moving averages, Fibonacci levels, Pivot Points, etc. Knowing where these congestion points are located is very useful for the trader, and can be used as a basis for different strategies.

This tool assigns a certain amount of “weight” to each indicator, and this “weight” can influence adjacents price levels. This means that one price level without any indicator or moving average but under the influence of two “strongly weighted” levels accumulate more resistance than their neighbors. In these cases, the tool signals resistance in apparently empty areas.

Learn more about Technical Confluence

Information on these pages contains forward-looking statements that involve risks and uncertainties. Markets and instruments profiled on this page are for informational purposes only and should not in any way come across as a recommendation to buy or sell in these assets. You should do your own thorough research before making any investment decisions. FXStreet does not in any way guarantee that this information is free from mistakes, errors, or material misstatements. It also does not guarantee that this information is of a timely nature. Investing in Open Markets involves a great deal of risk, including the loss of all or a portion of your investment, as well as emotional distress. All risks, losses and costs associated with investing, including total loss of principal, are your responsibility. The views and opinions expressed in this article are those of the authors and do not necessarily reflect the official policy or position of FXStreet nor its advertisers. The author will not be held responsible for information that is found at the end of links posted on this page.

If not otherwise explicitly mentioned in the body of the article, at the time of writing, the author has no position in any stock mentioned in this article and no business relationship with any company mentioned. The author has not received compensation for writing this article, other than from FXStreet.

FXStreet and the author do not provide personalized recommendations. The author makes no representations as to the accuracy, completeness, or suitability of this information. FXStreet and the author will not be liable for any errors, omissions or any losses, injuries or damages arising from this information and its display or use. Errors and omissions excepted.

The author and FXStreet are not registered investment advisors and nothing in this article is intended to be investment advice.

Recommended Content


Recommended Content

Editors’ Picks

AUD/USD: The hunt for the 0.7000 hurdle

AUD/USD: The hunt for the 0.7000 hurdle

AUD/USD quickly left behind Wednesday’s strong pullback and rose markedly past the 0.6900 barrier on Thursday, boosted by news of fresh stimulus in China as well as renewed weakness in the US Dollar.

AUD/USD News
EUR/USD refocuses its attention to 1.1200 and above

EUR/USD refocuses its attention to 1.1200 and above

Rising appetite for the risk-associated assets, the offered stance in the Greenback and Chinese stimulus all contributed to the resurgence of the upside momentum in EUR/USD, which managed to retest the 1.1190 zone on Thursday.

EUR/USD News
Gold holding at higher ground at around $2,670

Gold holding at higher ground at around $2,670

Gold breaks to new high of $2,673 on Thursday. Falling interest rates globally, intensifying geopolitical conflicts and heightened Fed easing bets are the main factors. 

Gold News
Bitcoin displays bullish signals amid supportive macroeconomic developments and growing institutional demand

Bitcoin displays bullish signals amid supportive macroeconomic developments and growing institutional demand

Bitcoin (BTC) trades slightly up, around $64,000 on Thursday, following a rejection from the upper consolidation level of $64,700 the previous day. BTC’s price has been consolidating between $62,000 and $64,700 for the past week.

Read more
RBA widely expected to keep key interest rate unchanged amid persisting price pressures

RBA widely expected to keep key interest rate unchanged amid persisting price pressures

The Reserve Bank of Australia is likely to continue bucking the trend adopted by major central banks of the dovish policy pivot, opting to maintain the policy for the seventh consecutive meeting on Tuesday.

Read more
Five best Forex brokers in 2024

Five best Forex brokers in 2024

VERIFIED Choosing the best Forex broker in 2024 requires careful consideration of certain essential factors. With the wide array of options available, it is crucial to find a broker that aligns with your trading style, experience level, and financial goals. 

Read More

Majors

Cryptocurrencies

Signatures