GBP/USD bounces off 200-day SMA [Video]
-
GBP/USD finds support at uptrend line.
-
But short-term outlook remains neutral.
-
MACD and RSI are mixed.
![GBP/USD bounces off 200-day SMA [Video]](https://editorial.fxstreet.com/images/Markets/Currencies/Majors/GBPUSD/iStock-472155766_XtraLarge.jpg)
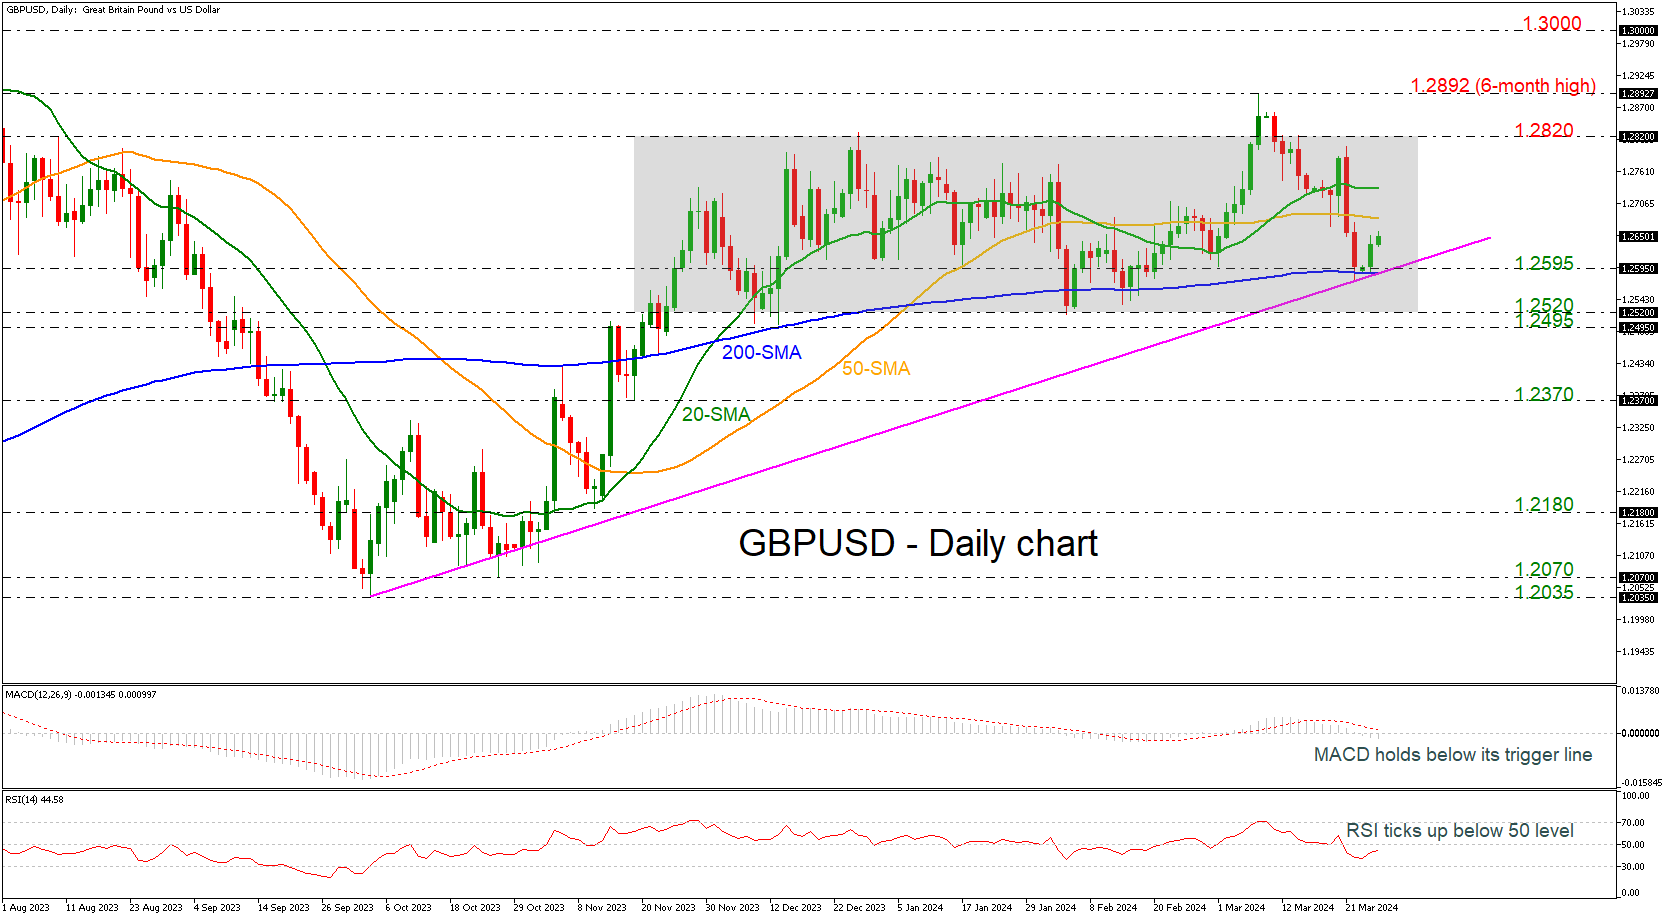
GBP/USD rebounded off the 200-day simple moving average (SMA), which coincides with the 1.2595 support level and the medium-term ascending trend line. The market has still been developing within a consolidation area since November 21, despite the break to the upside that it had on March 8, which seems to be a failed signal.
Technically, the MACD oscillator is moving beneath its trigger and zero lines; however, the RSI is pointing upwards in the bearish territory.
If the market continues to the upside, it could find immediate resistance at the 50-day SMA at 1.2680 ahead of the 20-day SMA at 1.2730. Surpassing these lines, the upper boundary of the channel may halt bullish actions at 1.2820.
On the flip side, a successful dive below the uptrend line and the 200-day SMA, then the market may switch to a bearish one, hitting the 1.2495-1.2520 support region. Even lower, the 1.2370 barricade could be the next level to look for.
In a nutshell, GBP/USD returns to a neutral phase after the climb towards the six-month peak of 1.2892 and to endorse the bullish outlook again, traders need to wait for a climb beyond the aforementioned level.
Author

Melina joined XM in December 2017 as an Investment Analyst in the Research department. She can clearly communicate market action, particularly technical and chart pattern setups.


