GBP/JPY three wave pullback coming after ending impulse rally [Video]
![GBP/JPY three wave pullback coming after ending impulse rally [Video]](https://editorial.fxstreet.com/images/Markets/Currencies/Crosses/GBPJPY/iStock-688526532_XtraLarge.jpg)
The short-term Elliott wave view in GBPJPY suggests that the pullback to 176.26 low ended larger degree wave (4). While the pullback unfolded as a zigzag structure where wave A ended at 179.45 low. Wave B bounce ended at 182.52 high and wave C managed to reach the 177.65- 174.63 100%-161.8% Fibonacci extension area of A-B. From there, the pair started the next leg higher in an impulse sequence & due a 3-wave pullback minimum soon before more upside happens.
GBP/JPY 1-hour Elliott Wave chart from 8.02.2023
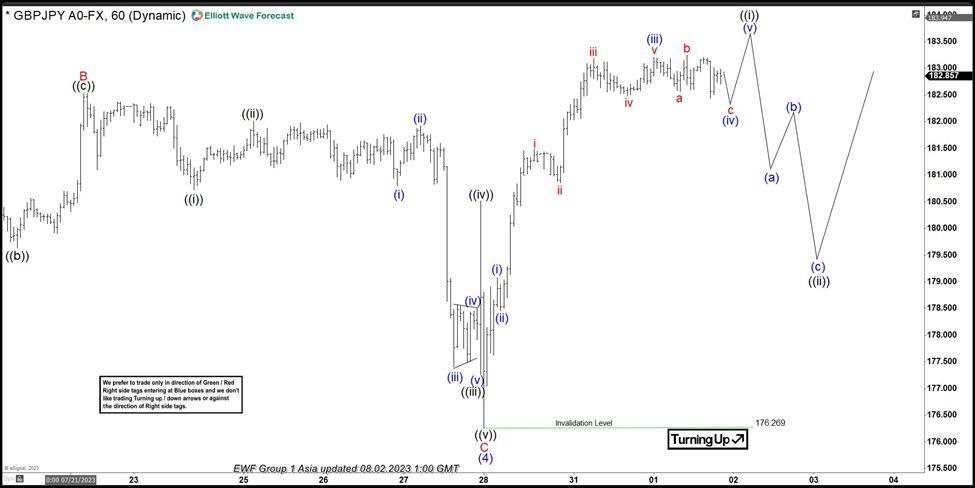
Up from the 176.26 low, the rally took place in an impulse sequence where lesser degree wave (i) ended at the 179.08 high. A pullback to 178.45 low ended small wave (ii) pullback & then the pair made another 5 waves rally within wave (iii) at 183.20 high. Down from there, the pair is doing a short-term pullback in wave (iv) towards the 182.46- 182.21 area before the pair makes a last push higher in wave (v) & ends wave ((i)). Afterward, the pair is expected to see a pullback in wave ((ii)) in 3, 7, or 11 swings before more upside happens. Near-term, as far as dips remain above the 176.26 low expect pair to extend higher.
GBP/JPY Elliott Wave video
Author

Elliott Wave Forecast Team
ElliottWave-Forecast.com


