GBP/JPY Elliott Wave technical analysis [Video]
![GBP/JPY Elliott Wave technical analysis [Video]](https://editorial.fxstreet.com/images/Markets/Currencies/Crosses/GBPJPY/iStock-688526532_XtraLarge.jpg)
GBPJPY Elliott Wave Analysis Trading Lounge.
British Pound/Japanese Yen (GBPJPY).
GBP/JPY Elliott Wave technical analysis
-
Function: Counter Trend.
-
Mode: Impulsive.
-
Structure: Navy Blue Wave 1.
-
Position: Gray wave C.
-
Next higher degree direction: Navy Blue Wave 2.
Details:
-
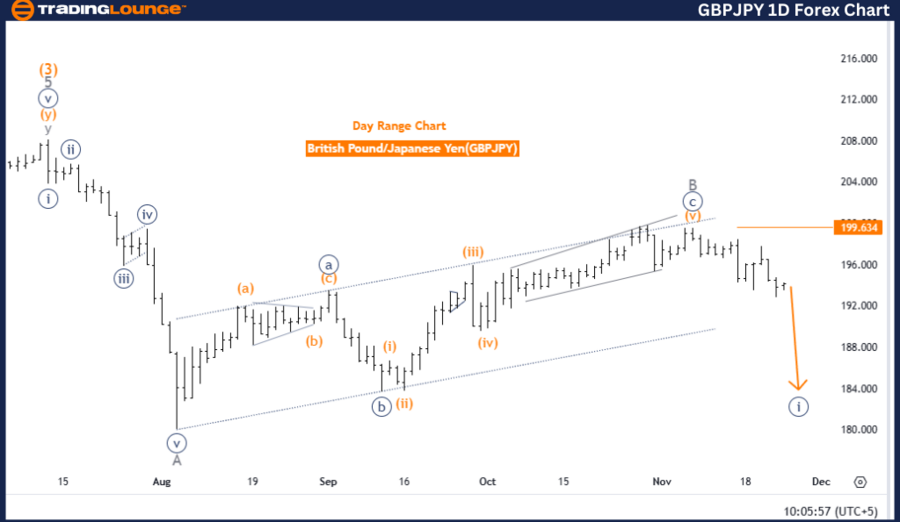
The analysis indicates that gray wave B appears completed, with navy blue wave 1 of gray wave C now in motion.
-
Invalidation Level: 199.634.
Analysis summary
This analysis examines the GBPJPY currency pair using the Elliott Wave theory on a daily chart, identifying a counter-trend movement. The current mode is impulsive, signaling strong directional activity within a broader corrective structure.
Key points:
-
The primary focus is navy blue wave 1, initiated after the completion of gray wave B, marking a new phase in the corrective pattern.
-
The market is positioned within gray wave C, a corrective wave within the larger structure.
-
The next anticipated development is navy blue wave 2, a corrective phase expected after the impulsive move of wave 1.
Critical benchmark for validation
The analysis specifies an invalidation level of 199.634. If the price reaches or exceeds this level, the current wave count and outlook will be invalidated. This serves as a key reference for managing risk and validating trends.
Conclusion
The Elliott Wave analysis suggests GBPJPY is currently in a counter-trend phase. Navy blue wave 1 within gray wave C is unfolding, initiated by the completion of gray wave B. The trend remains valid as long as the price stays below the invalidation level of 199.634. Traders can anticipate continued movement within this counter-trend structure, followed by the corrective navy blue wave 2.
British Pound/Japanese Yen (GBPJPY).
GBP/JPY Elliott Wave technical analysis
-
Function: Bearish Trend.
-
Mode: Impulsive.
-
Structure: Orange wave 3.
-
Position: Navy Blue Wave 1.
-
Next Higher Degree Direction: Orange wave 4.
Details:
-
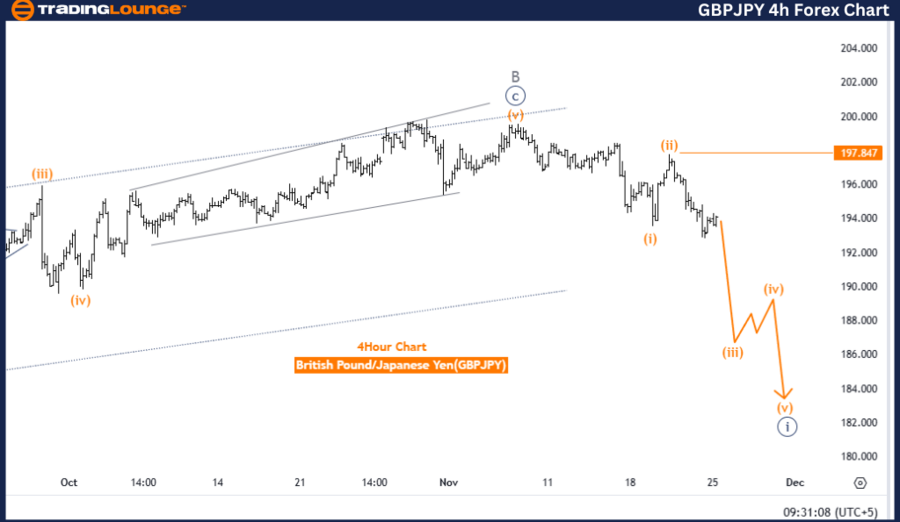
Orange wave 2 appears completed, and orange wave 3 is now unfolding.
-
Invalidation Level: 197.847
Analysis summary
This analysis evaluates the GBPJPY currency pair using Elliott Wave theory on a 4-hour chart, identifying a bearish trend. The impulsive mode reflects strong downward momentum within the broader structure.
Key highlights:
-
The primary focus is orange wave 3, initiated after the completion of orange wave 2, marking the start of a prolonged bearish phase.
-
The market is currently in navy blue wave 1, the early stage of the downward movement within orange wave 3.
-
The next anticipated move is orange wave 4, a corrective wave expected after orange wave 3 completes.
Critical benchmark for validation
An invalidation level of 197.847 is specified. If the price rises to this level, the current wave count and analysis will be invalidated. This benchmark is crucial for risk management and trend confirmation.
Conclusion
The Elliott Wave analysis suggests GBPJPY is in a bearish phase, with orange wave 3 actively progressing. The completion of orange wave 2 confirms the beginning of this trend, supported by the impulsive nature of the current movement. As long as the price remains below the invalidation level of 197.847, the bearish outlook is maintained. Traders can expect continued downward momentum before transitioning to the corrective phase, orange wave 4.
Technical analyst: Malik Awais.
GBP/JPY Elliott Wave technical analysis [Video]
Author

Peter Mathers
TradingLounge
Peter Mathers started actively trading in 1982. He began his career at Hoei and Shoin, a Japanese futures trading company.


