GBP/JPY Elliott Wave technical analysis [Video]
![GBP/JPY Elliott Wave technical analysis [Video]](https://editorial.fxstreet.com/images/Markets/Currencies/Crosses/GBPJPY/iStock-688526532_XtraLarge.jpg)
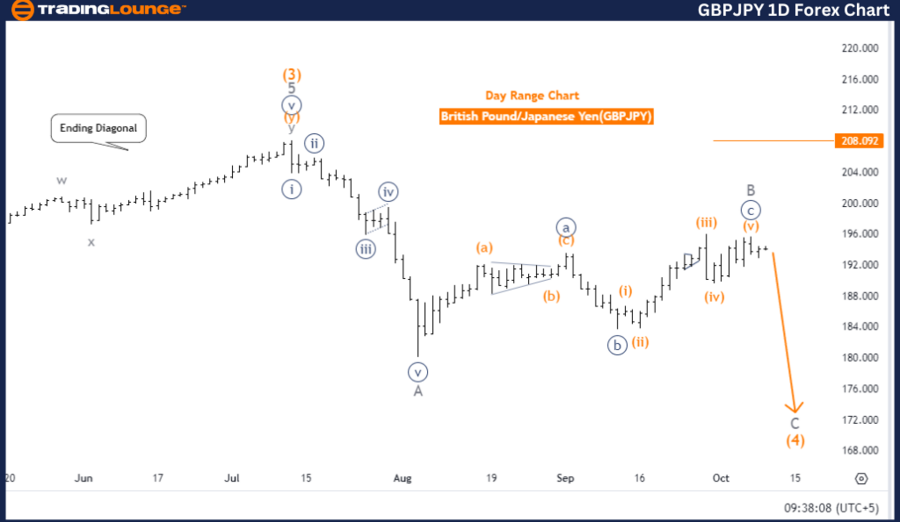
British Pound/Japanese Yen (GBPJPY) Day Chart
GBP/JPY Elliott Wave technical analysis
-
Function: Counter Trend.
-
Mode: Impulsive.
-
Structure: Gray Wave C.
-
Position: Orange Wave 4.
-
Direction next higher degree: Orange Wave 5.
Details
-
Gray Wave B of Orange Wave 4 appears to be complete. Now, Gray Wave C of Wave 4 is unfolding.
-
Invalidation Level: 208.092.
The GBPJPY Elliott Wave analysis on the daily chart indicates a counter-trend movement within a larger impulsive structure. The current wave pattern is labeled as Gray Wave C, which signifies that the market is in the final stage of a corrective phase. The mode is impulsive, demonstrating strong momentum in the ongoing wave. This wave position, Orange Wave 4, is part of a larger degree structure that will eventually progress into Orange Wave 5.
In this analysis, Gray Wave B of Orange Wave 4 is now considered complete. The market has transitioned into Gray Wave C, which is the final stage of Orange Wave 4. This indicates that the market is still in a corrective phase but is nearing the end of this correction. Once Gray Wave C is complete, the market is expected to resume its impulsive trend in Orange Wave 5.
The invalidation level for this wave structure is set at 208.092. If the market exceeds this level, the current wave count will be invalidated, and a new analysis will be required to reassess the market's direction.
Summary
The GBPJPY daily chart presents a counter-trend scenario, with Gray Wave C of Orange Wave 4 currently active. Gray Wave B has been completed, and the market is progressing through the final phase of correction before resuming the impulsive trend in Orange Wave 5. The wave count remains valid as long as prices stay below 208.092.
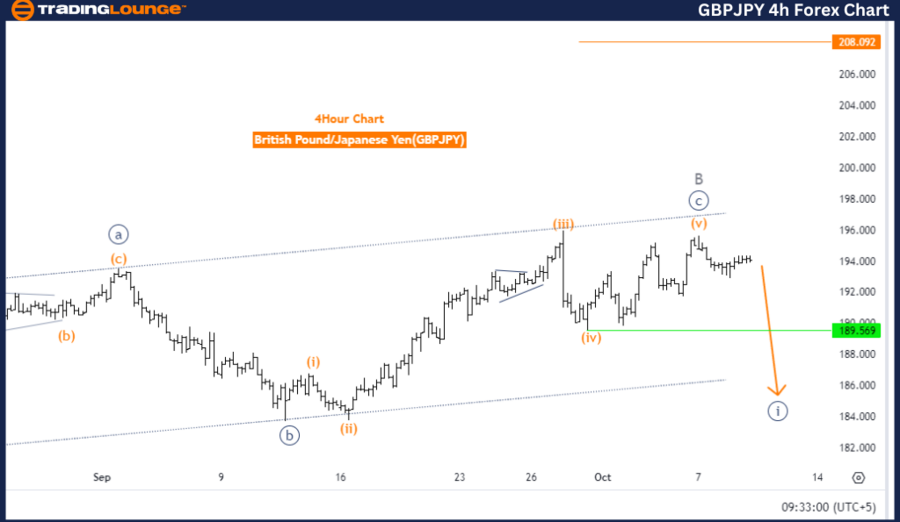
British Pound/Japanese Yen (GBPJPY) four-hour chart.
GBP/JPY Elliott Wave technical analysis
-
Function: Counter Trend
-
Mode: Impulsive
-
Structure: Navy Blue Wave 1
-
Position: Gray Wave C
-
Direction next higher degree: Navy Blue Wave 2
Details
-
Gray Wave B is considered complete. Now, Navy Blue Wave 1 of Gray Wave C is active.
-
Invalidation Level: 208.092.
The GBPJPY Elliott Wave analysis on the 4-hour chart shows a counter-trend movement, which indicates a corrective phase within a larger impulsive trend. The mode is impulsive, reflecting strong momentum in the current wave structure. The main structure in focus is Navy Blue Wave 1, which has started forming within Gray Wave C.
The analysis concludes that Gray Wave B has completed, transitioning the market into Navy Blue Wave 1. This wave is part of the larger Gray Wave C and represents a crucial phase shift from the corrective Wave B to the impulsive Wave C, continuing the corrective trend on this timeframe.
Looking forward, the next higher degree is Navy Blue Wave 2, which will follow after the completion of Navy Blue Wave 1. This phase will likely begin another stage in the ongoing counter-trend. Traders should expect further movement aligned with this wave structure as long as the wave count remains valid.
The invalidation level is set at 208.092. If prices exceed this level, the current wave count will be invalidated, requiring a reassessment of the market direction and wave structure.
Summary
The GBPJPY 4-hour chart analysis indicates the market is in a counter-trend mode with the impulsive formation of Navy Blue Wave 1 within Gray Wave C. Gray Wave B has completed, and the ongoing trend is expected to continue as long as prices remain below the 208.092 invalidation level.
GBP/JPY Elliott Wave technical analysis [Video]
Author

Peter Mathers
TradingLounge
Peter Mathers started actively trading in 1982. He began his career at Hoei and Shoin, a Japanese futures trading company.


