GBP/JPY Elliott Wave technical analysis [Video]
![GBP/JPY Elliott Wave technical analysis [Video]](https://editorial.fxstreet.com/images/Markets/Currencies/Crosses/GBPJPY/iStock-688526532_XtraLarge.jpg)
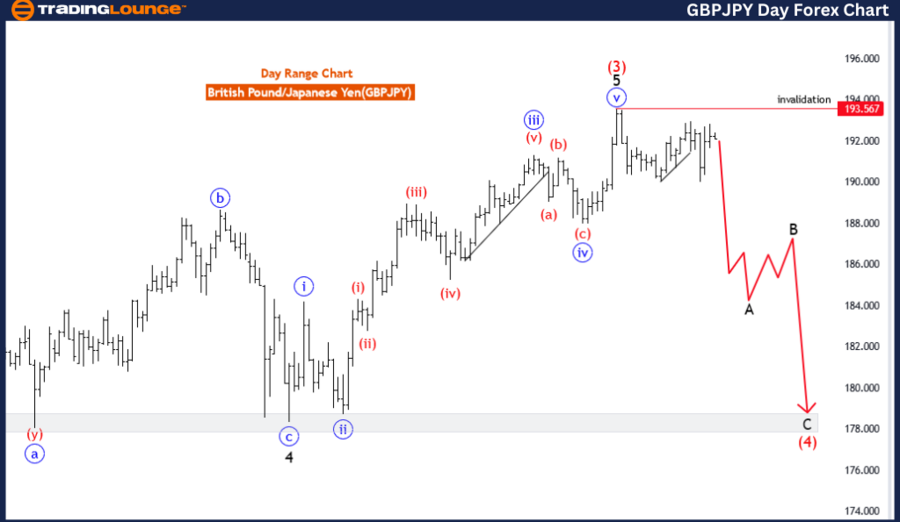
GBP/JPY Elliott Wave technical analysis
Function: Counter Trend.
Mode: corrective.
Structure: Black wave A.
Position: Red wave 4.
Direction next higher degrees: Black wave B.
Details: Red wave 3 completed at 193.567, now black wave A of 4 is in play. Wave Cancel invalid level: 193.567.
The GBP/JPY Elliott Wave Analysis for the daily chart offers insights into the potential price movements of the British Pound against the Japanese Yen, utilizing Elliott Wave principles for technical analysis.
Identified as a "Counter Trend," the analysis suggests that the current market movement is contrary to the prevailing trend. This indicates that the GBP/JPY pair may be undergoing a temporary corrective phase against the dominant trend direction.
Described as "Corrective" in mode, the analysis indicates that the current market movement exhibits characteristics of a corrective wave. This suggests that the ongoing price action may represent a temporary pause or retracement within the broader trend.
The "STRUCTURE" is labeled as "black wave A," providing clarity on the current phase of the Elliott Wave cycle. This assists traders in understanding the nature of the corrective movement and its potential impact on future price action.
Positioned as "red wave 4," the analysis highlights the specific phase of the Elliott Wave cycle within the current corrective movement. This suggests that the market is currently in the fourth wave of the larger corrective sequence, indicating a temporary counter-trend movement.
In the "DIRECTION NEXT HIGHER DEGREES" section, the analysis mentions "black wave B," indicating the anticipated direction for the subsequent higher-degree wave within the Elliott Wave cycle. This suggests that the market may experience a subsequent corrective phase following the completion of the current corrective wave.
The "DETAILS" section notes that "red wave 3 completed at 193.567, now black wave A of 4 is in play." This suggests that the previous corrective wave has concluded, and the market is now in the initial phase of the current corrective movement within the broader fourth wave.
Additionally, the wave cancel level is noted at 193.567, serving as a reference point for invalidating the wave count. Traders may use this information to assess potential trading opportunities and manage risk accordingly.
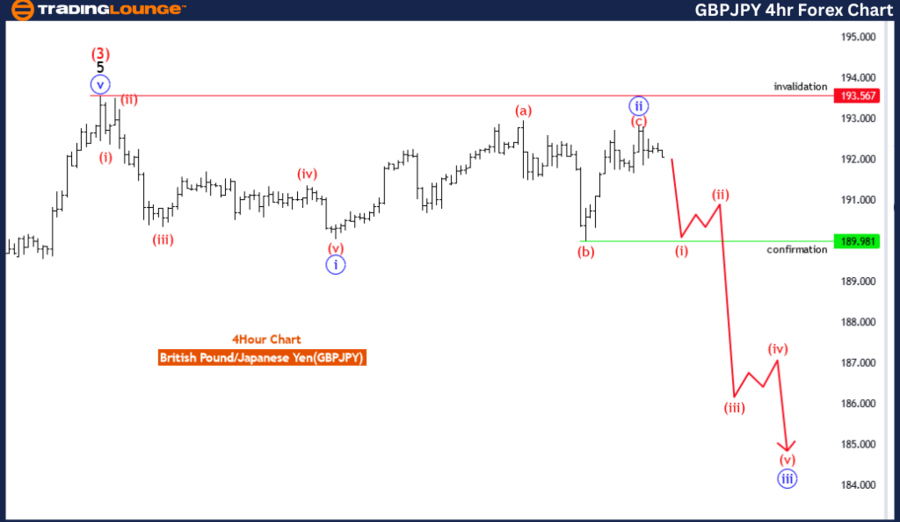
GBP/JPY four-hour chart
Function: Trend.
Mode: impulsive.
Structure: Red wave 1.
Position: Blue wave 3.
Direction next higher degrees: Red wave 2
Details: Blue wave 2 looking completed at 192.837, now red wave 1 of blue wave 3 is in play. Wave Cancel invalid level: 193.567
The GBP/JPY Elliott Wave Analysis for the 4-hour chart provides insights into potential price movements of the British Pound against the Japanese Yen, utilizing Elliott Wave principles for technical analysis.
Identified as a "Trend," the analysis suggests that the prevailing market direction aligns with the broader uptrend. This indicates that the GBP/JPY pair may be experiencing a sustained movement in the direction of the dominant trend.
Described as "Impulsive" in mode, the analysis indicates that the current market movement exhibits characteristics of an impulsive wave. This suggests a strong and decisive directional move in the GBP/JPY pair, typically associated with the continuation of the underlying trend.
The "STRUCTURE" is labeled as "red wave 1," providing clarity on the current wave count within the Elliott Wave cycle. This assists traders in understanding the ongoing impulsive movement and its alignment with the broader trend.
Positioned as "blue wave 3," the analysis highlights the specific phase of the Elliott Wave cycle within the current impulsive movement. This indicates that the market is currently in the third wave of the larger impulsive sequence, suggesting a strong directional move.
In the "DIRECTION NEXT HIGHER DEGREES" section, the analysis mentions "red wave 2," indicating the anticipated direction for the subsequent higher-degree wave within the Elliott Wave cycle. This suggests that the market may experience a temporary corrective phase following the completion of the current impulsive wave.
The "DETAILS" section notes that "blue wave 2 looking completed at 192.837, now red wave 1 of blue wave 3 is in play." This suggests that the previous corrective wave has likely concluded, and the market is now in the first wave of the current impulsive movement within the broader third wave. Additionally, the wave cancel level is noted at 193.567, serving as a reference point for invalidating the wave count. Traders may use this information to assess potential trading opportunities and manage risk accordingly.
GBP/JPY Elliott Wave technical analysis [Video]
Author

Peter Mathers
TradingLounge
Peter Mathers started actively trading in 1982. He began his career at Hoei and Shoin, a Japanese futures trading company.


