GBP/CAD Elliott Wave buying the dips at the blue box
In this technical article we’re going to take a quick look at the Elliott Wave charts of GBPUSD Forex Pair , published in members area of the website. As our members know, GBPUSD has recently given us correction against the 1.2664 low. The pair reached our target zone and completed correction right at the Equal Legs ( Blue Box Area) . In further text we’re going to explain the Elliott Wave pattern and trading setup.
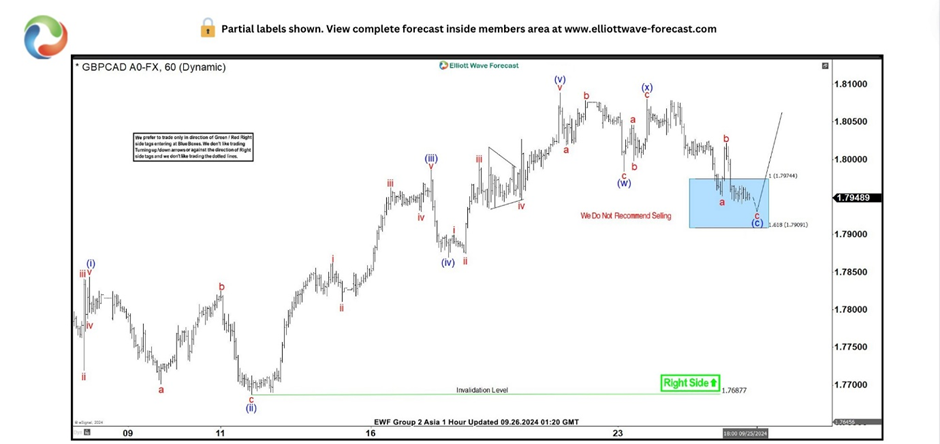
GBP/CAD one-hour update 09.26.2024
GBPCAD is correcting cycle from the 1.7687 low. The pull back looks to be unfolding as Double Three pattern. The price has already reached the extreme zone and we are aware that correction can complete any moment. We advise against selling GBPCAD at this stage. The pair should ideally attract buyers at the Blue Box zone. We can see either rally towards new highs or a larger corrective bounce in three waves at least. Once the bounce reaches the 50% Fibonacci retracement level against the connector high – (x) blue , we’ll secure our position by moving the stop-loss to breakeven. To safeguard our trade, we’ll closely monitor for any break below the marked invalidation level : 1.2941
A quick reminder:
Our charts are designed for simplicity and ease of trading:
Red bearish stamp + blue box = Selling Setup
Green bullish stamp + blue box = Buying Setup
Charts with Black stamps are deemed non-tradable.
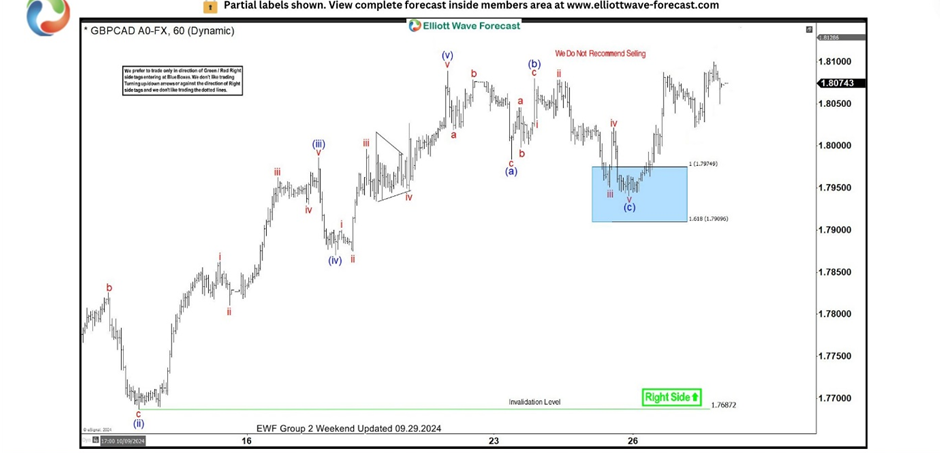
GBP/CAD one-hour update 09.26.2024
We got a nice rally from our buying zone toward new highs, confirming pull back completed at the 1.794 low. As a result, traders who entered long positions are now enjoying risk-free profits. With the price holding above the 1.794 low, we believe that more upside should be seen. We don’t like selling the pair in any proposed pull back, and prefer staying long from the blue box are in risk free positions.
Author

Elliott Wave Forecast Team
ElliottWave-Forecast.com


