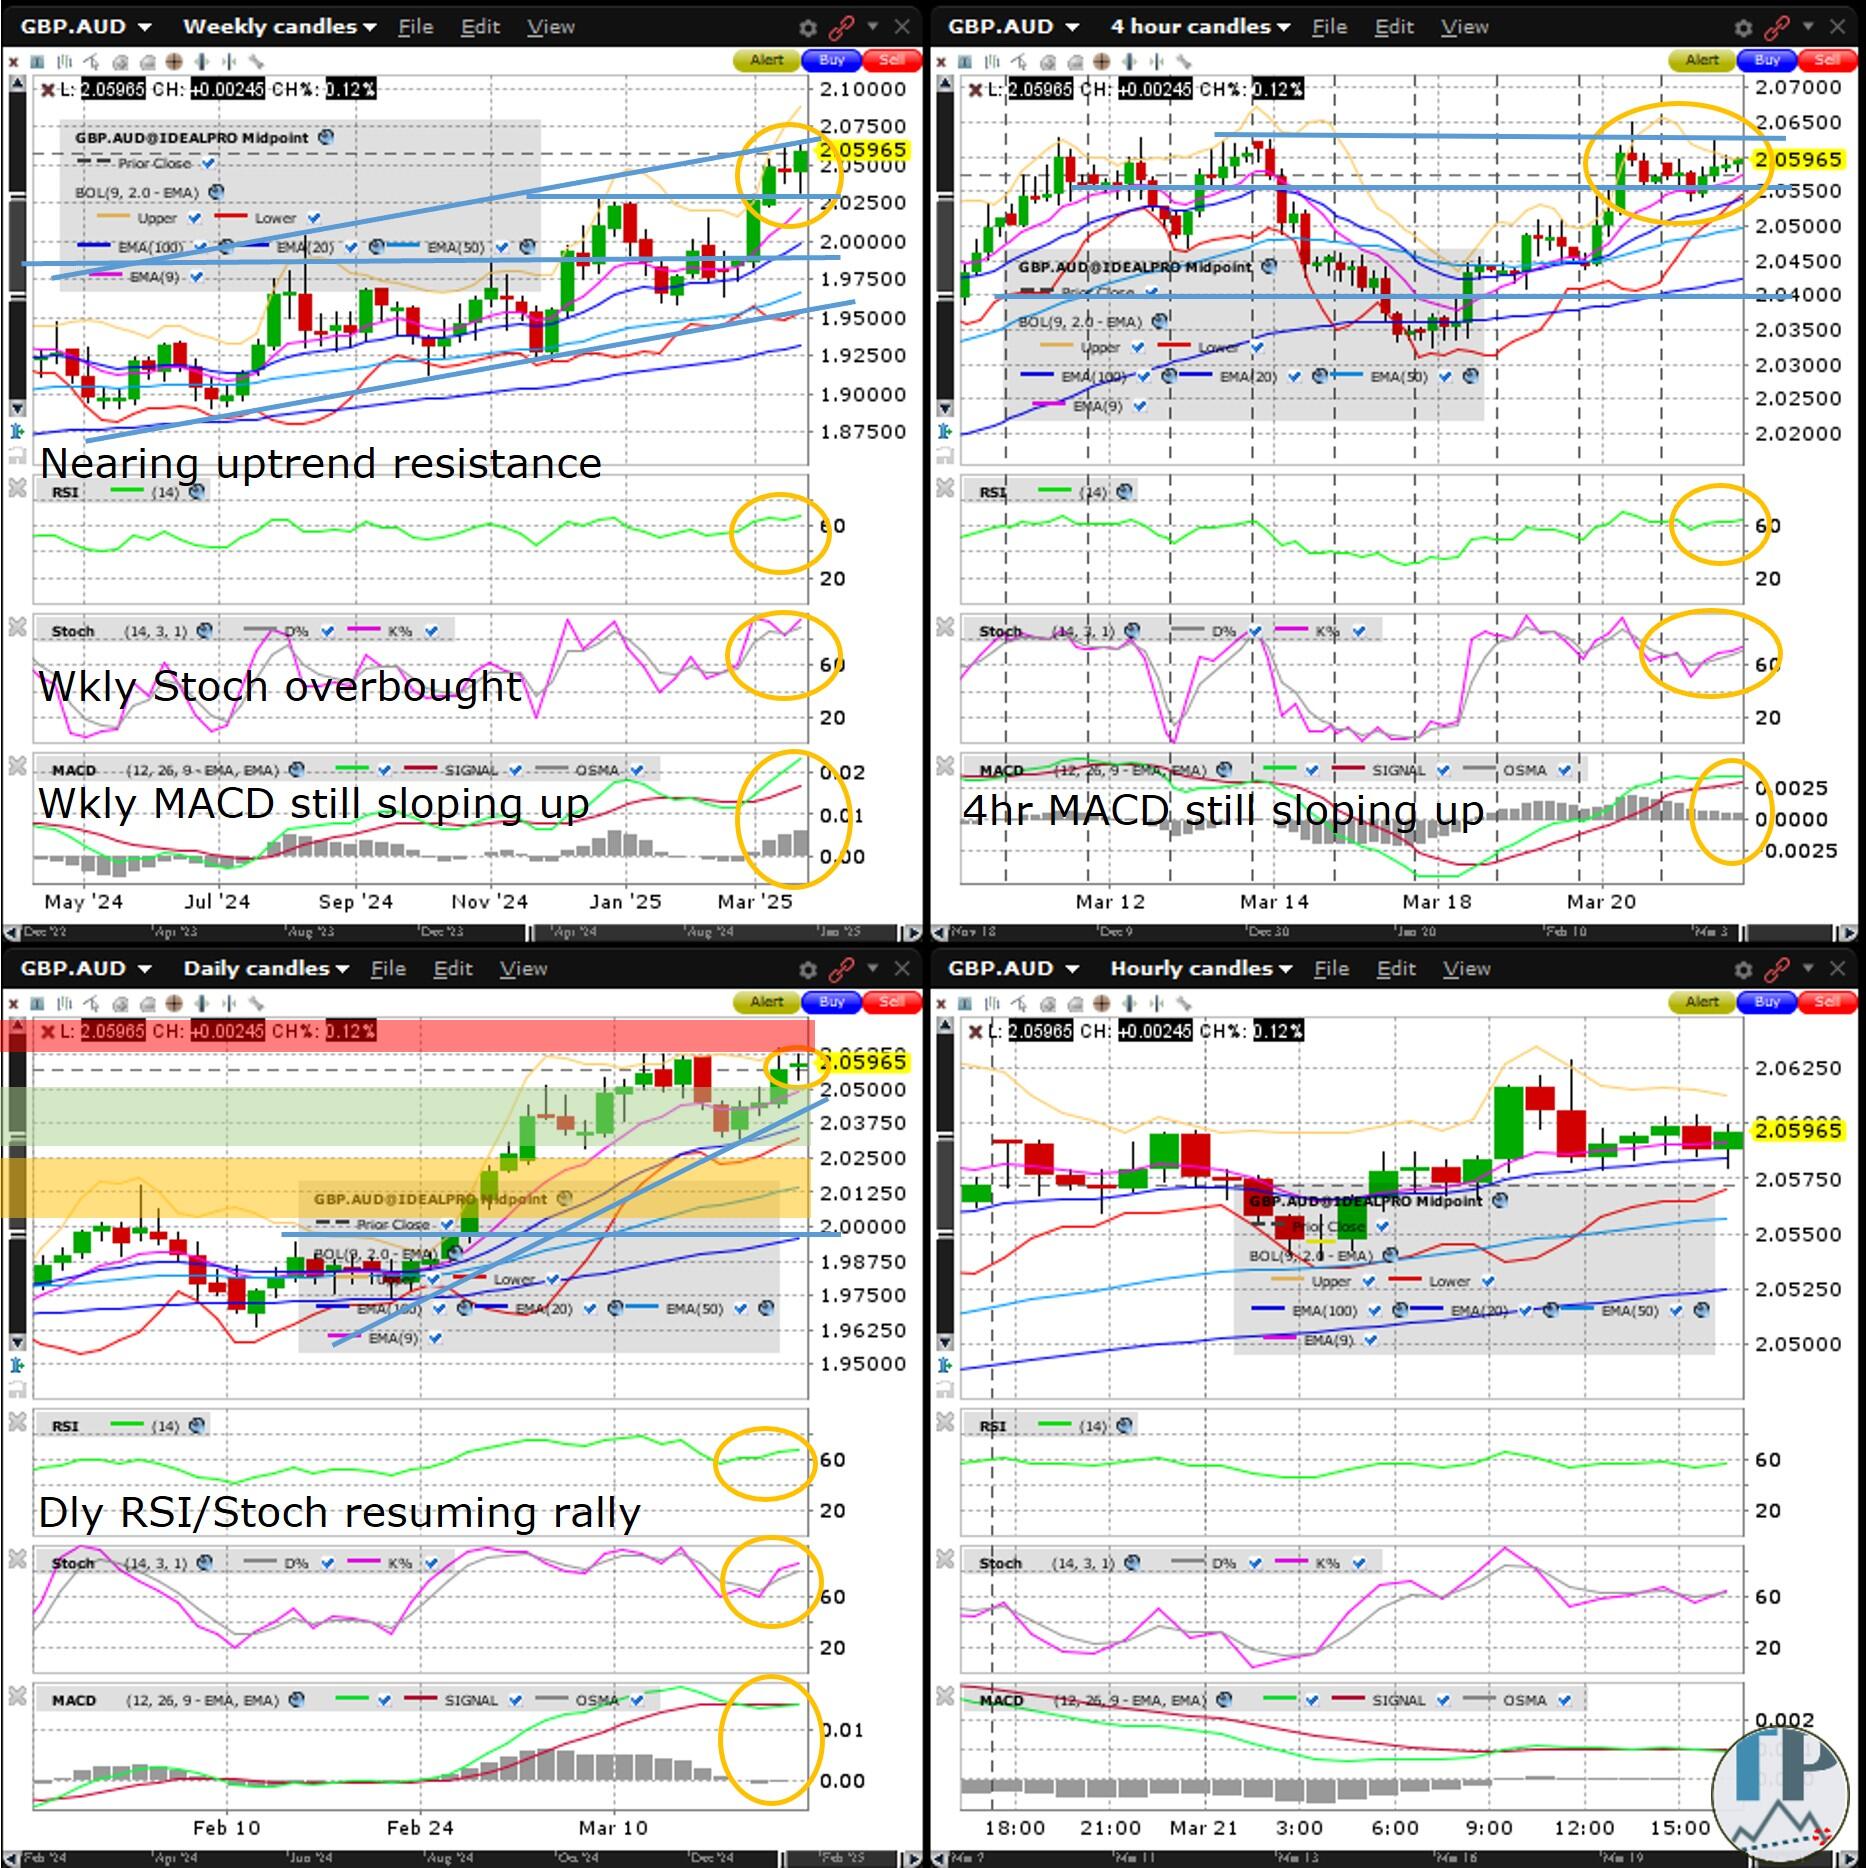
GBP/AUD nears weekly chart uptrend resistance

The GBP/AUD edged higher with a daily Doji Friday, closing the week near uptrend resistance and the 2025 high formed in March. Although the strong breakout last July above what is arguably a triangle resistance line connecting the highs of June 2004, August 2007 and March 2020 is due for a breather by April sometime, it could very well before month end first test the March 2020 high. Odds are elevated for a healthy pullback by early Q2 with a deeper slide below the psychologically key 2 whole figure level unlikely. Watch for volatility as early as Monday with the UK Flash manufacturing and services PMI, Tuesday with BoE Governor Bailey’s comments, Wednesday with the Australia and UK CPI and the UK’s annual budget release, and Friday with the UK retail sales. The weekly, daily and 4hr RSI, Stochastics and MACD are mostly rallying or consolidating recent gains. I am looking to go long in the green zone (of the daily chart), targeting the red zone for Friday. The amber/yellow zone is where I might place a stop if I was a swing trader (although in my personal account with which I seldom hold overnight I sometimes set my stops tighter).
Weekly/daily/4hr
Author

Darren Chu, CFA
Tradable Patterns
Darren Chu, CFA, ex-Intercontinental Exchange | NYSE Liffe, TMX Group, CMC Markets, is the founder of Tradable Patterns – a publisher of futures/FX technical analysis on Bloomberg, LSEG (Refinitiv) and Factset.


