GBP/AUD Elliott Wave technical analysis [Video]
![GBP/AUD Elliott Wave technical analysis [Video]](https://editorial.fxstreet.com/images/Markets/Currencies/Majors/DollarIndex/us-currency-2848629_XtraLarge.jpg)
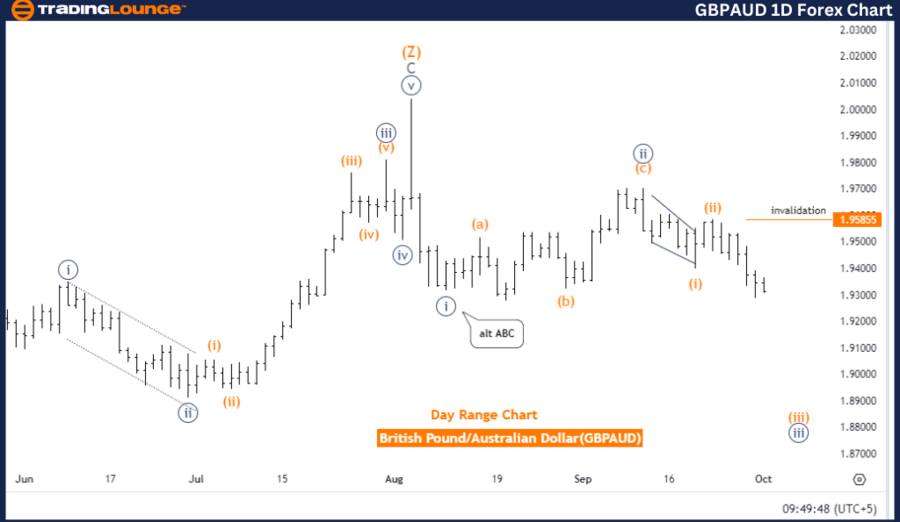
GBPAUD Elliott Wave Analysis Trading Lounge Day Chart.
British Pound/Australian Dollar (GBPAUD) Day Chart.
GBP/AUD Elliott Wave Technical Analysis
Function: Bearish Trend.
Mode: Impulsive.
Structure: Orange wave 3.
Position: Navy Blue Wave 3.
Direction next lower degrees: Orange wave 4.
The GBPAUD Elliott Wave Analysis for the daily chart reveals a bearish trend, suggesting that the British Pound is weakening against the Australian Dollar. This trend is classified as impulsive, which means the market is experiencing strong downward momentum. The focus is on orange wave 3, a significant part of the ongoing bearish movement.
The market is positioned within navy blue wave 3, which forms part of the larger downward trend. After the completion of orange wave 2, the market has now transitioned into orange wave 3, maintaining the downtrend. In Elliott Wave Theory, wave 3 in an impulsive sequence is typically the most powerful and extended, indicating that the bearish trend is strengthening as orange wave 3 progresses.
The next anticipated movement is orange wave 4, which will represent a corrective phase once orange wave 3 completes. However, as of now, orange wave 3 is still active, and the market is expected to continue its downward trajectory before any correction occurs. This suggests that bearish momentum is likely to persist in the near term.
A critical level to observe is 1.95855, which acts as the wave cancel invalidation point. If the market rises above this level, the current Elliott Wave analysis will be invalidated, requiring a reassessment of the market's wave structure. This invalidation point is crucial for traders, as it confirms whether the downtrend remains intact.
Summary
The GBPAUD Elliott Wave analysis points to a strong bearish trend, with orange wave 3 driving further declines. Traders should carefully monitor the invalidation level of 1.95855. Any movement above this level would invalidate the current analysis, potentially shifting the market outlook. Until then, the bearish trend is expected to continue unless this key level is breached.
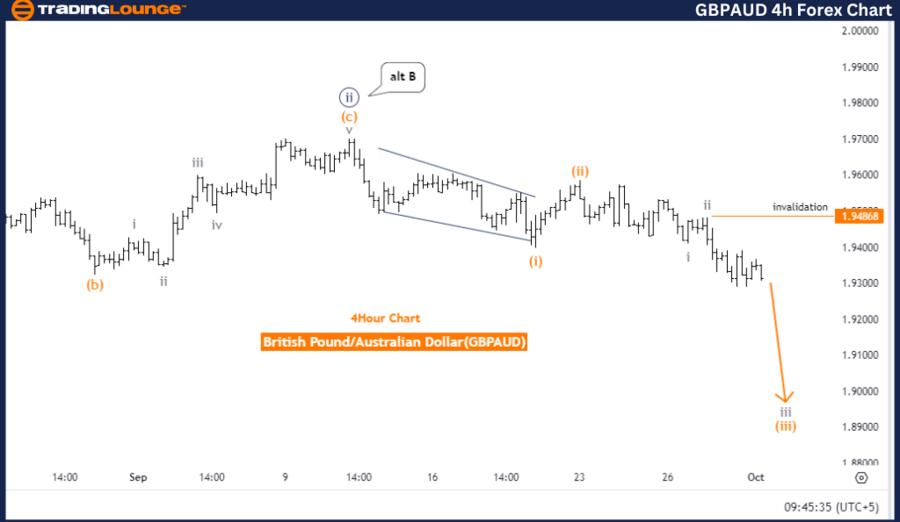
British Pound/Australian Dollar (GBPAUD) 4-Hour Chart.
GBP/AUD Elliott Wave technical analysis
Function: Bearish Trend.
Mode: Impulsive.
Structure: Gray wave 3.
Position: Orange wave 3.
Direction next higher degrees: Gray wave 4.
The GBPAUD Elliott Wave Analysis for the 4-hour chart indicates a bearish trend, suggesting a downward movement for the British Pound against the Australian Dollar. This trend is classified as impulsive, meaning the market is moving strongly in the direction of the trend. The primary focus of the analysis is on gray wave 3, which is driving this bearish movement.
Currently, the market is positioned within orange wave 3, which is part of the overall downward structure. Following the completion of gray wave 2, the market has entered gray wave 3, signaling a continuation of the bearish trend. In Elliott Wave Theory, wave 3 is usually the strongest in an impulsive sequence, indicating that the downtrend is gaining momentum as gray wave 3 progresses.
The next expected movement is gray wave 4, representing a corrective phase after the completion of wave 3. However, at this stage, gray wave 3 is still active, and the market is expected to continue moving lower before any corrective movement begins.
A critical level to monitor is 1.94868, which serves as the wave cancel invalidation point. If the market rises above this level, the current Elliott Wave analysis would be invalidated, and a reassessment of the wave structure would be necessary. This level is vital for traders as it confirms whether the bearish trend remains intact.
Summary
The GBPAUD Elliott Wave analysis for the 4-hour chart suggests a continued bearish trend, with gray wave 3 leading the downward movement. Traders should closely monitor the invalidation level of 1.94868, as any movement above this point would invalidate the current analysis. Until then, the bearish trend is expected to persist with further downside potential.
Technical analyst: Malik Awais.
GBP/AUD Elliott Wave technical analysis [Video]
Author

Peter Mathers
TradingLounge
Peter Mathers started actively trading in 1982. He began his career at Hoei and Shoin, a Japanese futures trading company.


