GBP/AUD Elliott Wave technical analysis [Video]
![GBP/AUD Elliott Wave technical analysis [Video]](https://editorial.fxstreet.com/images/Markets/Currencies/Majors/GBPUSD/british-currency-coins-and-notes-14982194_XtraLarge.jpg)
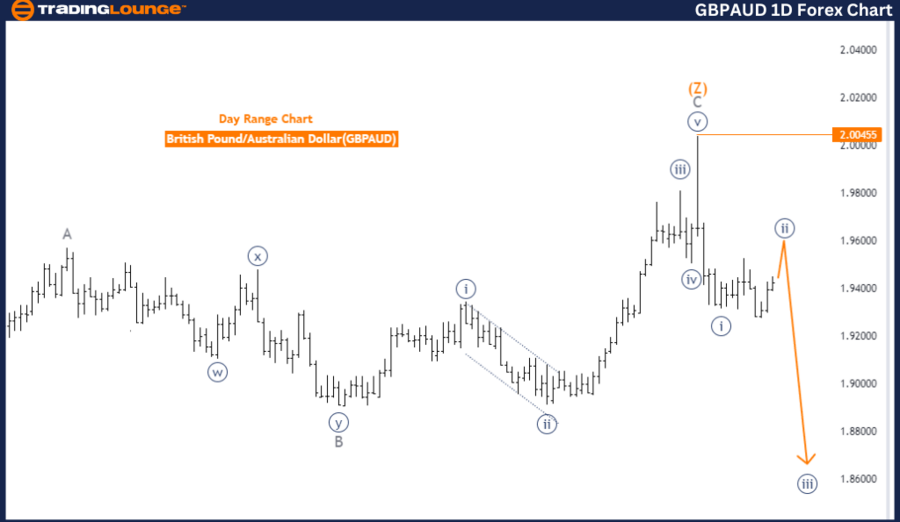
British Pound/Australian Dollar - Day Chart Analysis
GBP/AUD Elliott Wave technical analysis
-
Function: Counter Trend.
-
Mode: Corrective.
-
Structure: Navy Blue Wave 2.
-
Position: Gray wave 1.
-
Next lower degrees direction: Navy blue wave 3.
-
Details: Navy Blue Wave 1 appears complete; Navy Blue Wave 2 is currently in play.
-
Wave cancel invalid level: 2.00455.
The GBPAUD currency pair is currently in a corrective phase on the daily chart, as analyzed through Elliott Wave theory. This analysis suggests that the market is operating in a counter-trend mode, characterized by corrective patterns rather than impulsive movements.
The primary structure being observed is navy blue wave 2, indicating that the market is retracing following the completion of navy blue wave 1.
Currently, the market is positioned in gray wave 1, signifying the beginning of a potential new corrective pattern. Navy blue wave 1, the previous impulsive move, seems to have completed, and the market has now entered navy blue wave 2. This wave is typically corrective, meaning it moves against the direction of the previous trend, indicating a temporary retracement or consolidation.
The direction for the next lower degrees points to the development of navy blue wave 3, which would represent the next significant movement in the market once the current corrective phase concludes. Traders are closely monitoring this phase to determine when the corrective wave 2 will finish and the market will potentially resume its larger trend with wave 3.
A critical level to observe in this analysis is 2.00455, identified as the wave cancel invalid level. If the market surpasses this level, it would invalidate the current wave count, suggesting that the anticipated corrective structure might not develop as expected. This level serves as a key threshold for confirming or disproving the validity of the current Elliott Wave structure.
Summary:
The GBPAUD pair is in a corrective phase on the daily chart, with navy blue wave 2 currently in play following the completion of navy blue wave 1. The market is expected to transition into navy blue wave 3, but traders should closely watch the 2.00455 level to validate or invalidate the current wave analysis.
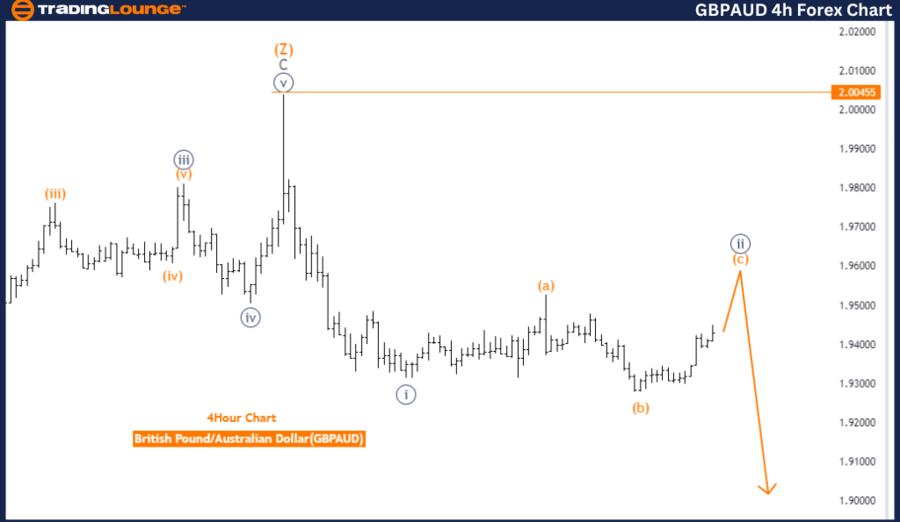
British Pound/Australian Dollar - 4 Hour Chart Analysis
GBP/AUD Elliott Wave technical analysis
-
Function: Counter Trend.
-
Mode: Corrective.
-
Structure: Navy Blue Wave 2.
-
Position: Gray wave 1.
-
Next lower degrees direction: Navy blue wave 3.
-
Details: Navy Blue Wave 1 appears complete; Navy Blue Wave 2 is currently in play.
-
Wave cancel invalid level: 2.00455.
The GBPAUD currency pair is currently undergoing analysis on the 4-hour chart using Elliott Wave theory. The analysis indicates that the market is in a counter-trend phase, characterized by a corrective mode. The primary structure being observed is navy blue wave 2, which is part of a larger corrective pattern.
At present, the market is positioned within gray wave 1, indicating the early stages of a potential new trend. However, since the current phase is corrective, the market is not yet in a strong impulsive movement. Instead, it is in a phase where the previous impulsive move, identified as navy blue wave 1, has likely completed, and the market is now retracing in navy blue wave 2.
Navy blue wave 2 is the primary focus at this stage, representing a corrective wave that typically moves in the opposite direction of the previous trend. This wave is part of a larger corrective pattern, suggesting that the market may see some consolidation or retracement before potentially resuming a new trend.
The next direction for lower degrees points to navy blue wave 3, which would represent the next impulsive move after the completion of the current corrective phase. Traders are closely monitoring this phase to determine when the corrective move will end and the market will resume its impulsive trend.
A crucial level to watch in this analysis is 2.00455, identified as the wave cancel invalid level. If the market moves beyond this level, the current wave count would be invalidated, indicating that the anticipated corrective structure might not unfold as expected. This level acts as a key threshold for confirming the validity of the current Elliott Wave structure.
Summary:
The GBPAUD pair is currently in a corrective phase on the 4-hour chart, with navy blue wave 2 in play following the completion of navy blue wave 1. The market is expected to eventually move into navy blue wave 3, but traders should monitor the 2.00455 level for any potential shifts in the market structure.
Technical analyst: Malik Awais.
GBP/AUD Elliott Wave technical analysis [Video]
Author

Peter Mathers
TradingLounge
Peter Mathers started actively trading in 1982. He began his career at Hoei and Shoin, a Japanese futures trading company.


