GBP/AUD Elliott Wave technical analysis [Video]
![GBP/AUD Elliott Wave technical analysis [Video]](https://editorial.fxstreet.com/images/Markets/Currencies/Crosses/GBPCAD/british-currency-coins-and-notes-14982194_XtraLarge.jpg)
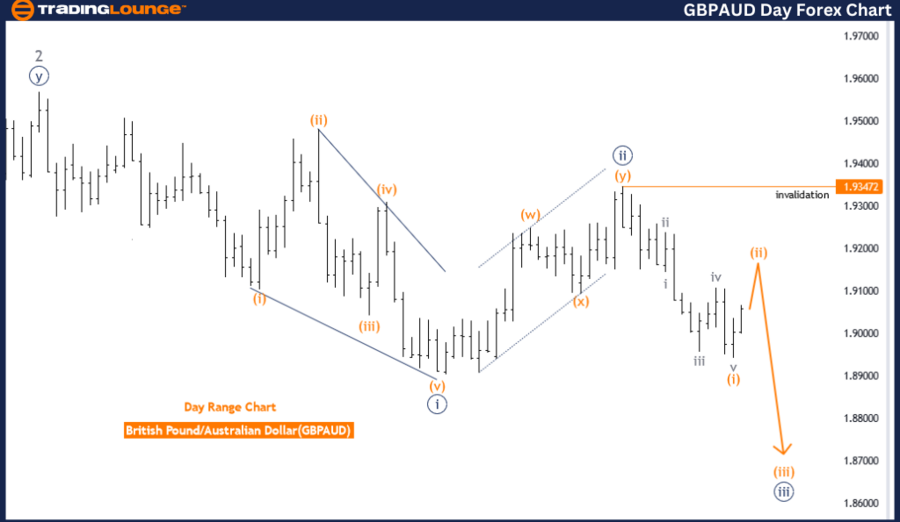
GBPAUD Elliott Wave Analysis Trading Lounge Day Chart.
GBP/AUD Elliott Wave technical analysis
Function: Trend.
Mode: Corrective.
Structure: Orange Wave 2.
Position: Navy Blue Wave 3.
Direction next lower degrees: Orange Wave 3.
Details: Orange wave 1 of 3 looking completed, now orange wave 2 is in play. Wave Cancel invalid level: 1.93472.
The GBPAUD Elliott Wave analysis on the daily chart provides an insightful look into the current market dynamics using Elliott Wave Theory. The analysis indicates the market function is a trend, meaning the market is following a specific direction rather than moving sideways or in a choppy manner.
Current market mode: Corrective
The mode of the market is described as corrective, indicating that the current phase is a pullback or retracement within a larger trend. This corrective mode is part of the broader trend and sets the stage for the next impulsive move.
Market structure: Orange Wave two
The market structure is identified as orange wave 2, a corrective wave in the Elliott Wave cycle. The market is currently undergoing a temporary correction before resuming its trend.
Position: Navy Blue Wave three
The position within this structure is navy blue wave 3, signifying this wave is in the development phase within the corrective mode.
Next lower degrees: Orange Wave three
The direction for the next lower degrees points towards orange wave 3, indicating that after the completion of the current corrective phase (orange wave 2), the market is expected to transition into an impulsive phase (orange wave 3). This anticipated move is important for traders as it signifies the potential for new trading opportunities in the direction of the broader trend.
Analysis details
-
Orange Wave 1 of 3 Completed: This suggests the initial phase of the impulsive move (orange wave 1) has finished, and the market is now in orange wave 2, a corrective phase.
-
Wave Cancel Invalid Level: The critical wave cancel invalid level is set at 1.93472. If the market falls below this point, the current wave count would be invalidated, necessitating a reevaluation of the wave structure.
Summary
The GBPAUD daily chart analysis identifies the market as being in a corrective trend within orange wave 2 and positioned in navy blue wave 3. The direction for the next lower degrees suggests an upcoming orange wave 3 impulsive phase. The market is currently experiencing orange wave 2 after completing orange wave 1 of 3, with a significant wave cancel invalid level at 1.93472.
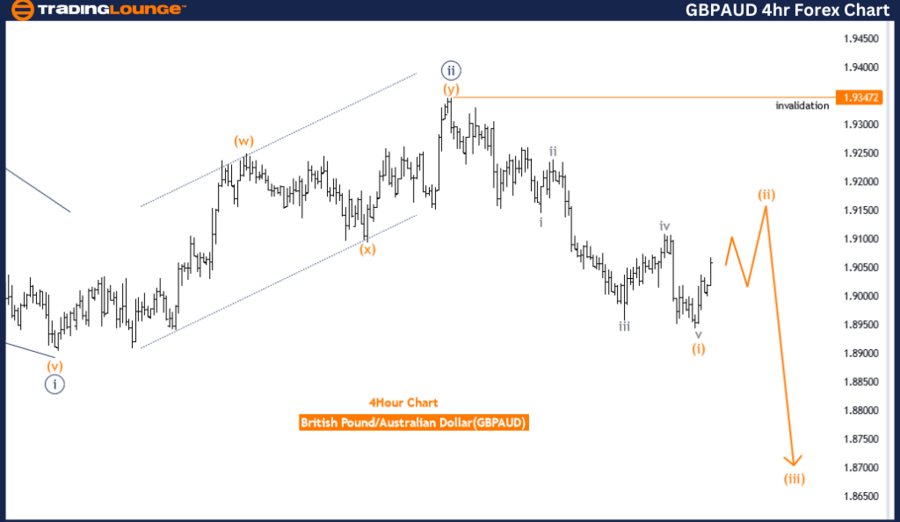
GBPAUD Elliott Wave Analysis Trading Lounge 4-Hour Chart.
GBP/AUD Elliott Wave technical analysis
Function: Trend.
Mode: Corrective.
Structure: Orange Wave 2.
Position: Navy Blue Wave 3.
Direction next lower degrees: Orange Wave 3.
Details: Orange wave 1 of 3 looking completed, now orange wave 2 is in play. Wave Cancel invalid level: 1.93472
The GBPAUD Elliott Wave analysis on the 4-hour chart provides an in-depth examination of the current market trends using Elliott Wave Theory. The analysis identifies the market function as a trend, indicating that the market is currently moving in a specific direction rather than experiencing consolidation or correction.
Current market mode: Corrective
The mode of the market is described as corrective, suggesting that the current phase is a temporary pullback within the broader trend. This corrective mode is part of the larger trend and is necessary to set up the next impulsive move.
Market structure: Orange Wave two
The market structure is highlighted as orange wave 2, which is a corrective wave in the Elliott Wave cycle. The position within this structure is navy blue wave 3, indicating that this wave is currently developing and is part of the corrective phase.
Next lower degrees: Orange Wave three
The direction for the next lower degrees points towards orange wave 3, indicating that after the completion of the current corrective phase, the market is expected to enter an impulsive phase. This anticipated shift from orange wave 2 to orange wave 3 is crucial for traders as it may present opportunities for new entries in the direction of the broader trend.
Analysis details
-
Orange Wave 1 of 3 Completed: This suggests the initial phase of the impulsive move has concluded, and the market is now in orange wave 2, a corrective phase.
-
Wave Cancel Invalid Level: The critical wave cancellation invalid level is set at 1.93472. If the market moves below this point, the current wave count would be invalidated, requiring a reassessment of the wave structure.
Summary
The GBPAUD 4-hour chart analysis identifies the market as being in a corrective trend, specifically within orange wave 2 and positioned in navy blue wave 3. The direction for the next lower degrees points towards a forthcoming orange wave 3 impulsive phase. The market is currently experiencing orange wave 2, following the completion of orange wave 1 of 3, with a critical wave cancel invalid level at 1.93472 that traders should monitor closely.
Technical analyst: Malik Awais.
GBP/AUD Elliott Wave technical analysis [Video]
Author

Peter Mathers
TradingLounge
Peter Mathers started actively trading in 1982. He began his career at Hoei and Shoin, a Japanese futures trading company.


