From White House to Gold house

S2N spotlight
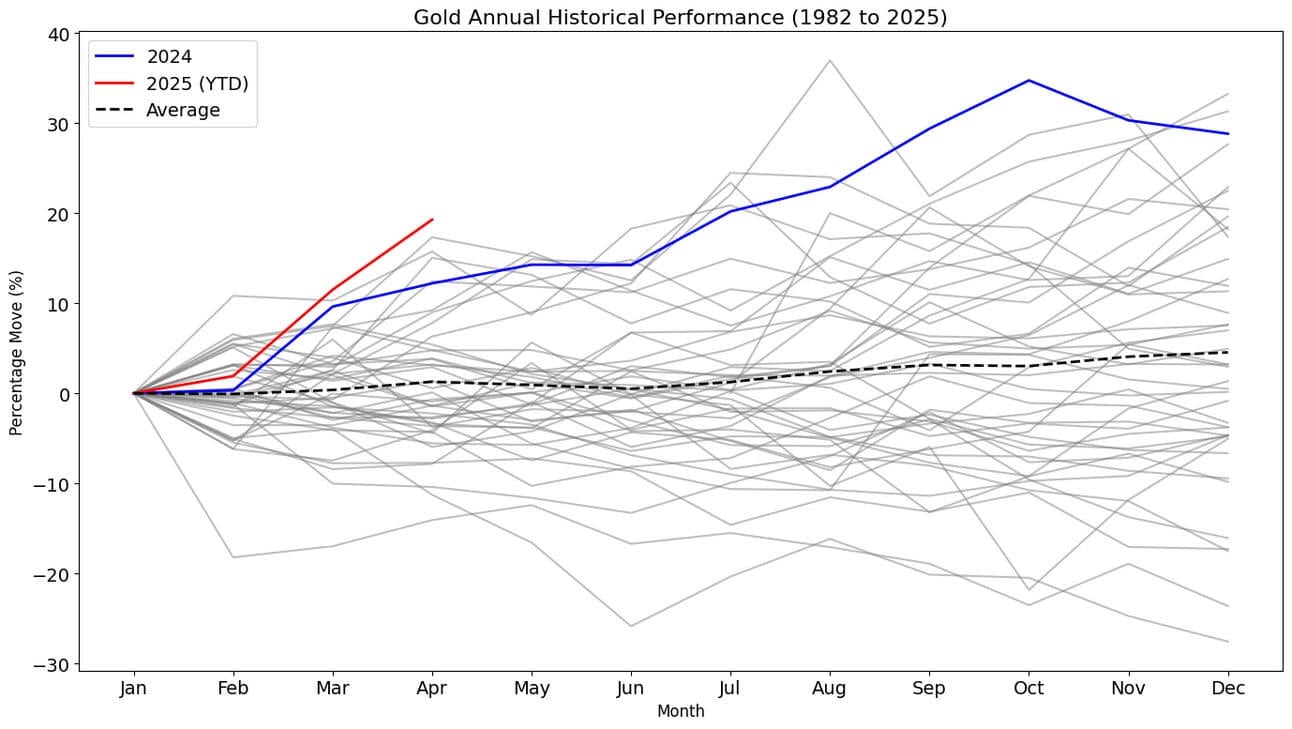
There is an archetypal motif at play that cannot be ignored. Gold continues its ascent—not because of a shortage of the yellow metal, but because of growing unease about the foundations of the financial system as we’ve known it.
For decades, the global economy has run on a printing press—conjuring money out of thin air, backed solely by the promise of the U.S. government and its reserve currency status. Long before Trump’s first term, doubts had already begun to surface about whether this monetary system could endure as it has for the past 40+ years.
And who better than the archetype of excess and spectacle to unconsciously reveal that beneath the pageantry of American power and its mighty dollar, gold remains the only true safe haven?
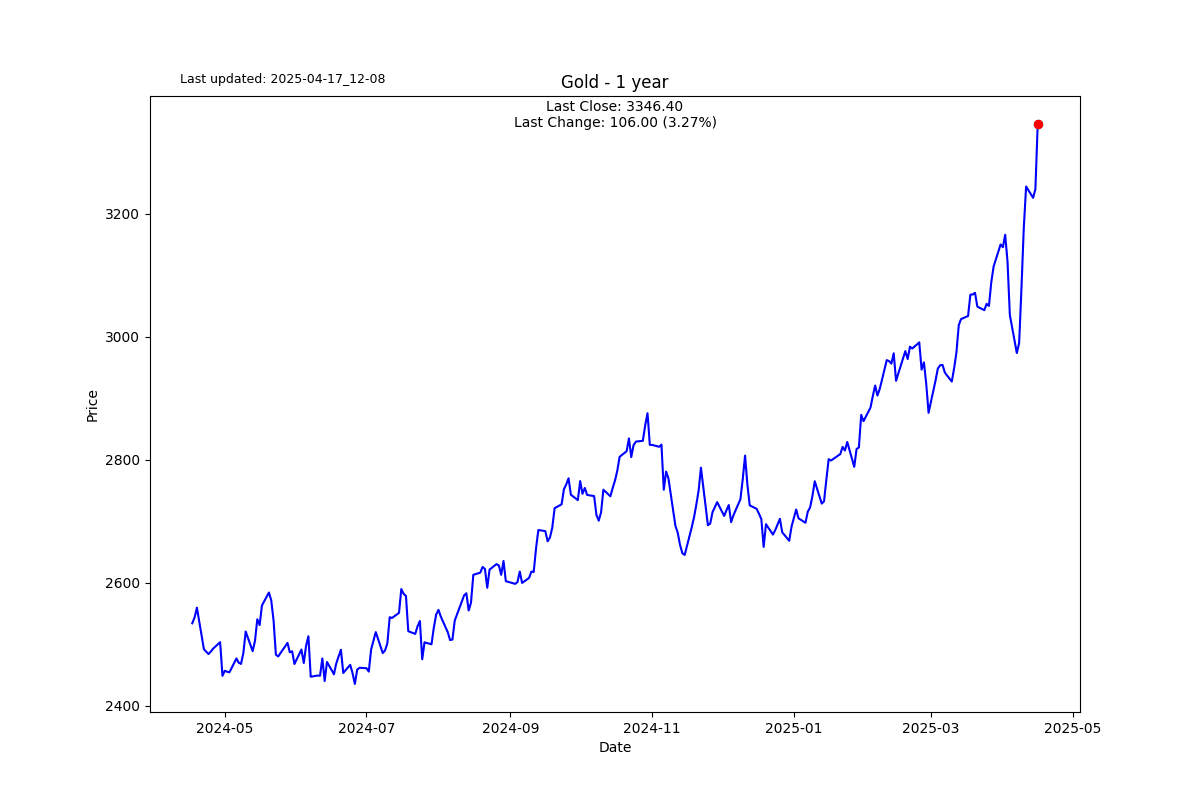
This chart says it all; I don’t need to get in the way.
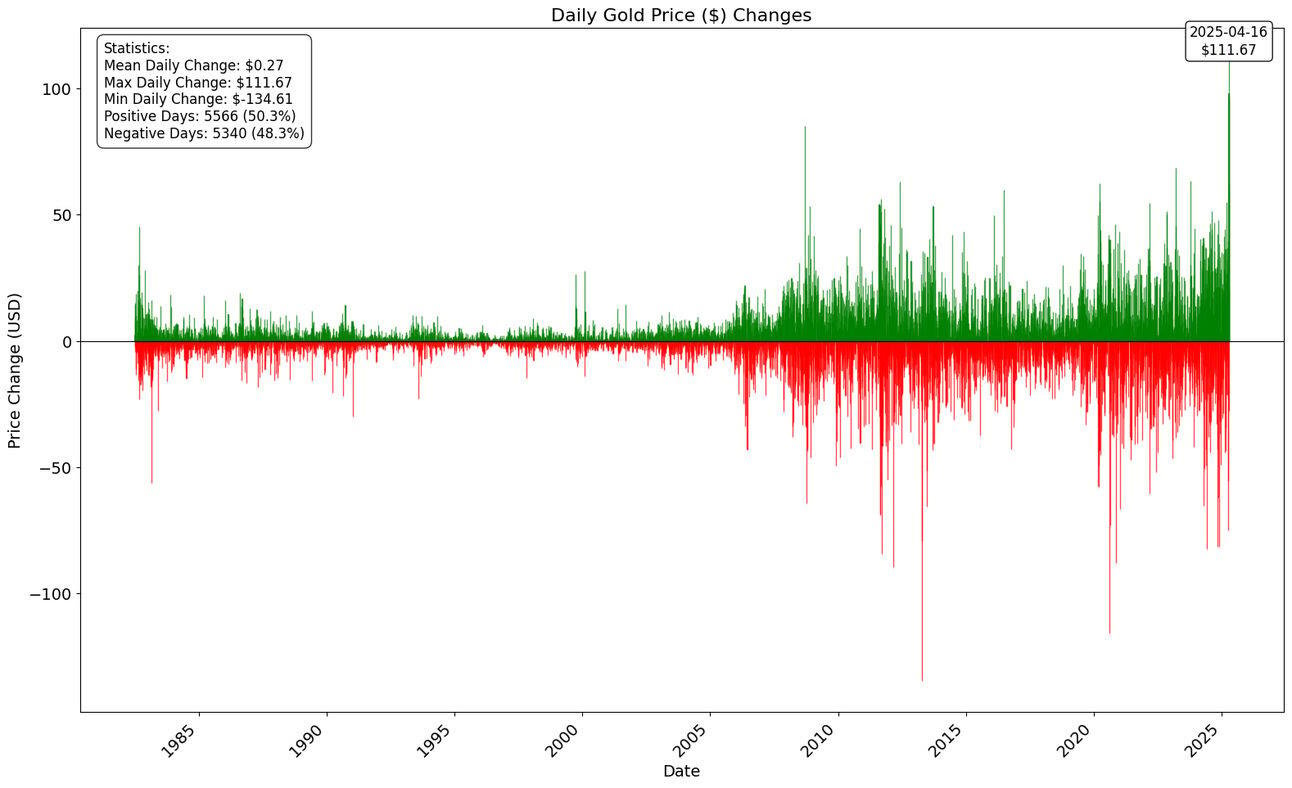
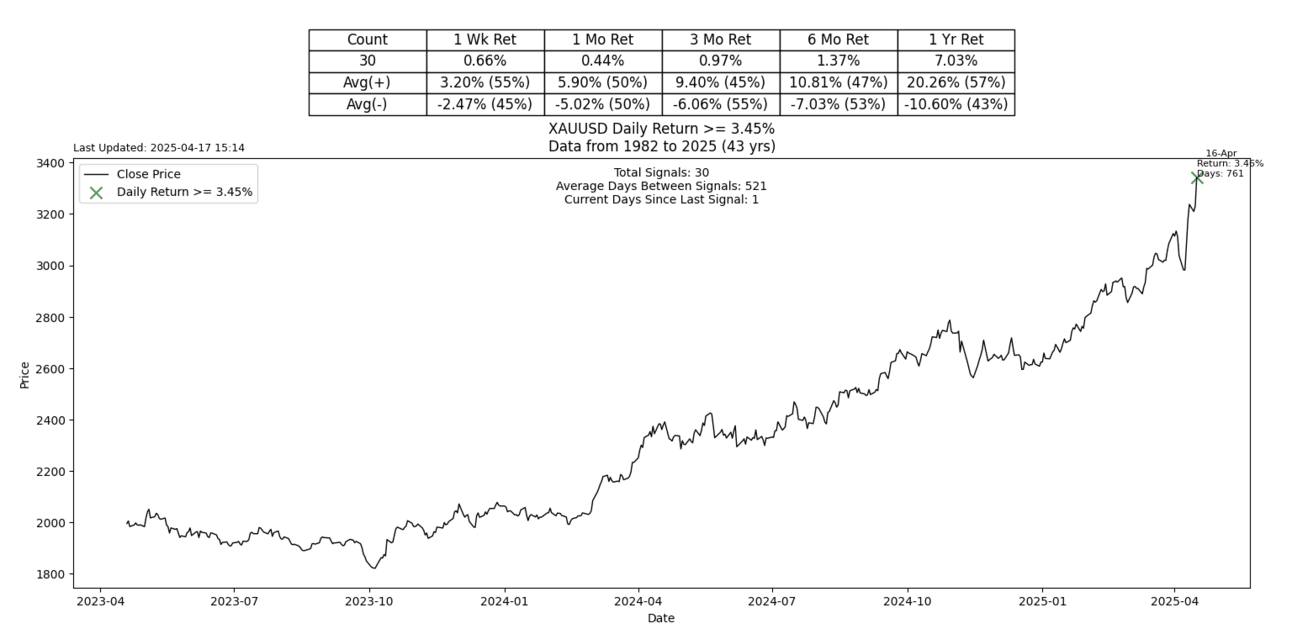
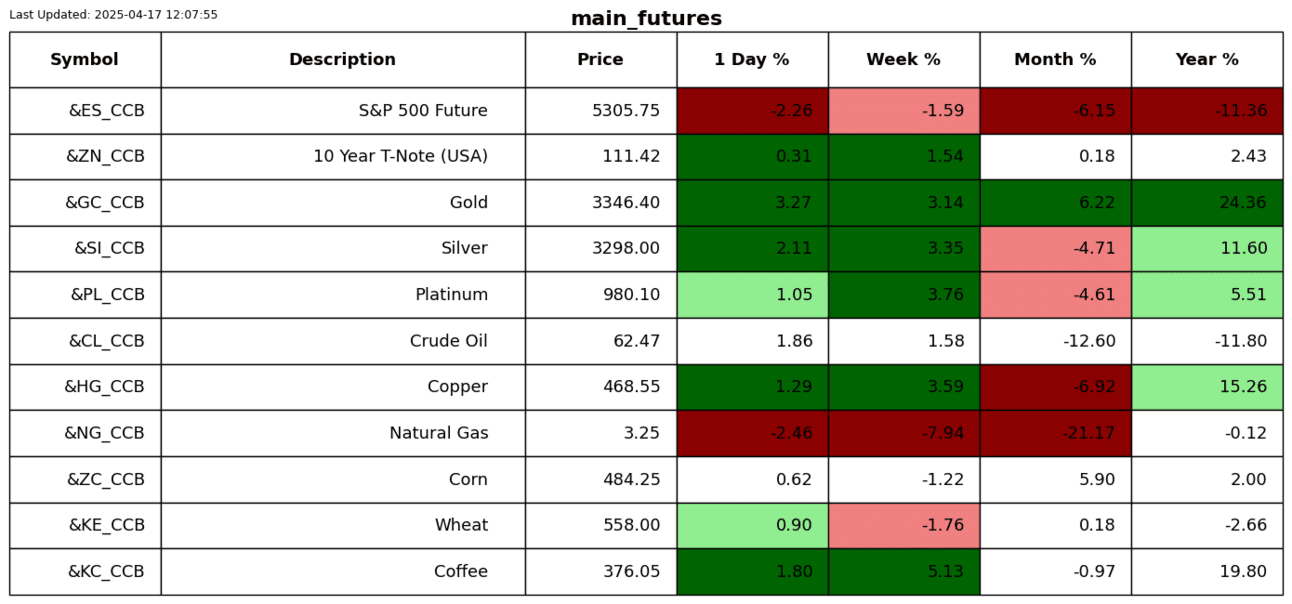
My brother-in-law texted me last night saying he doesn’t think he has ever seen a $100 daily move in gold before. Let’s check it out.
Looks like we have a record, $111.67.
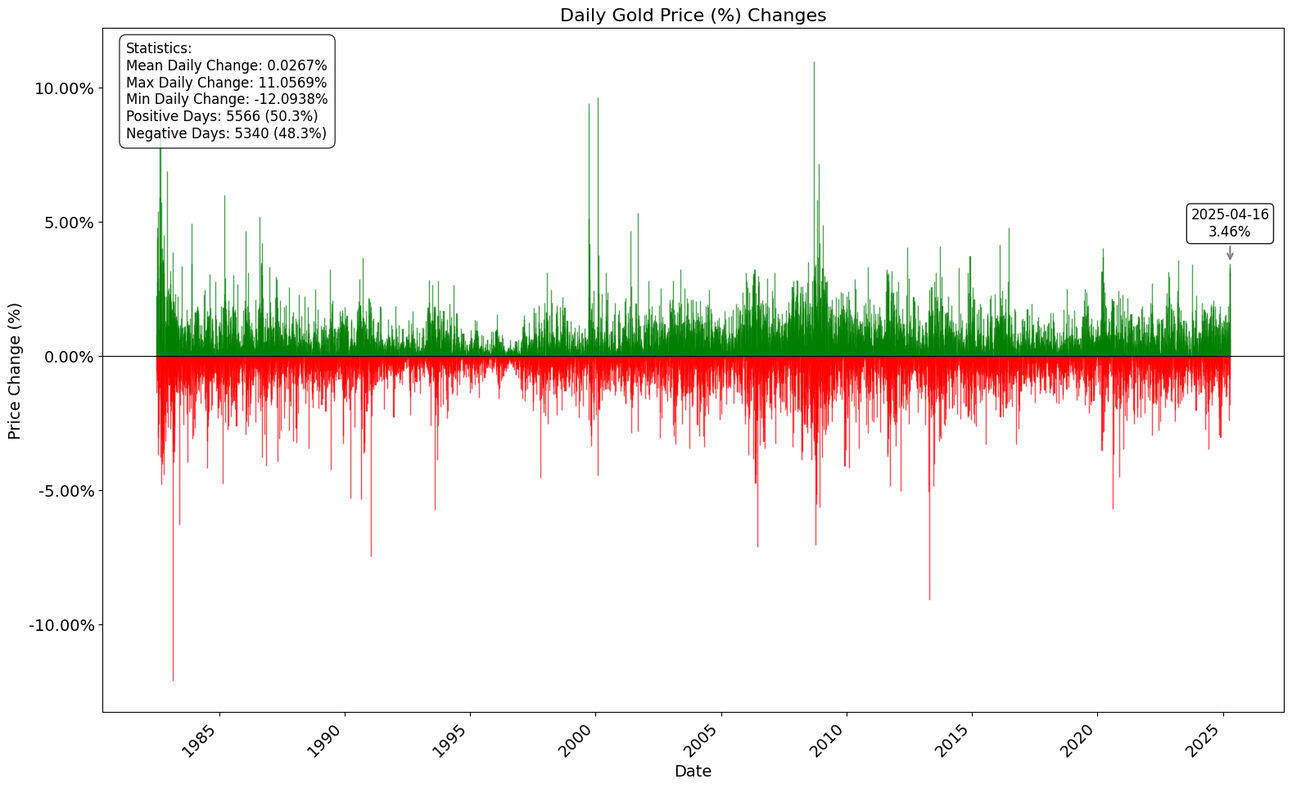
It is important to always look at things in context. As the price grows, the denominator is larger; therefore, the % change is not as impressive, but a 3.46% move is still very impressive.
S2N observations
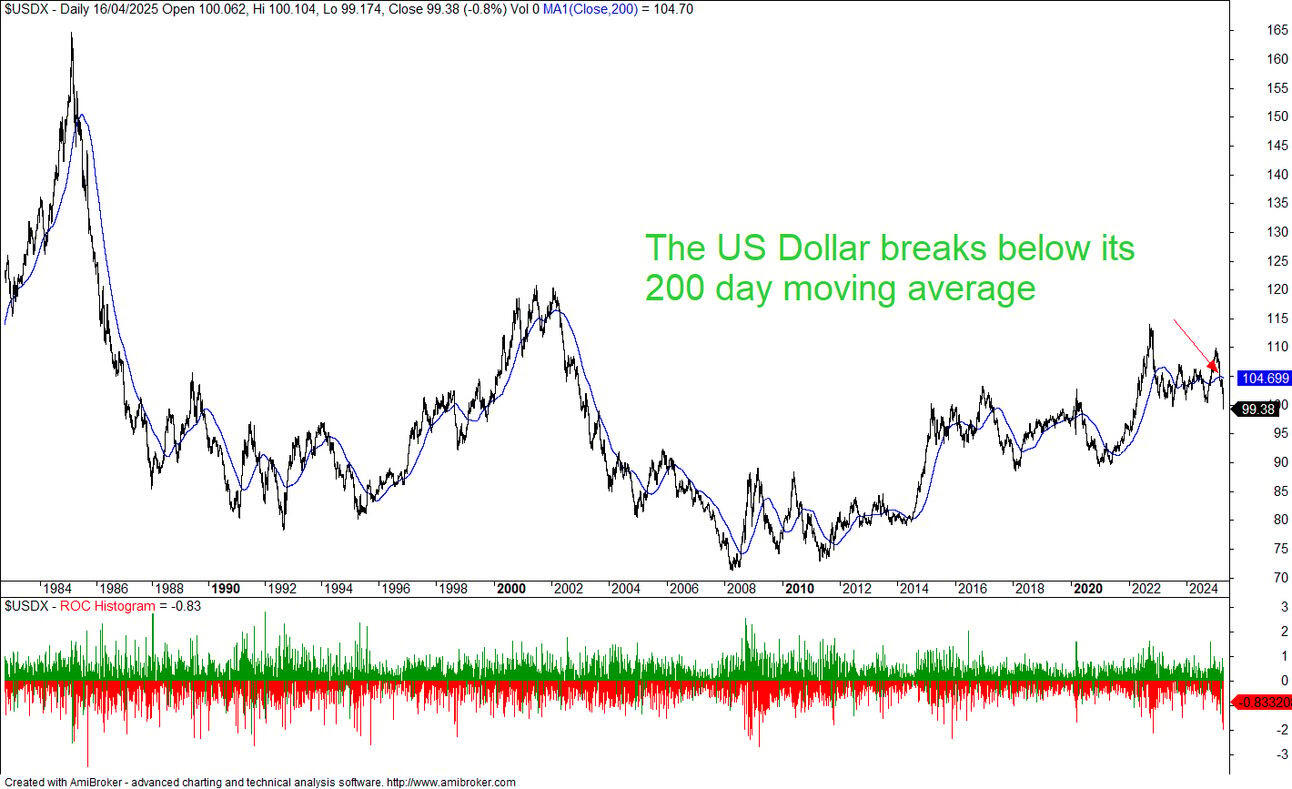
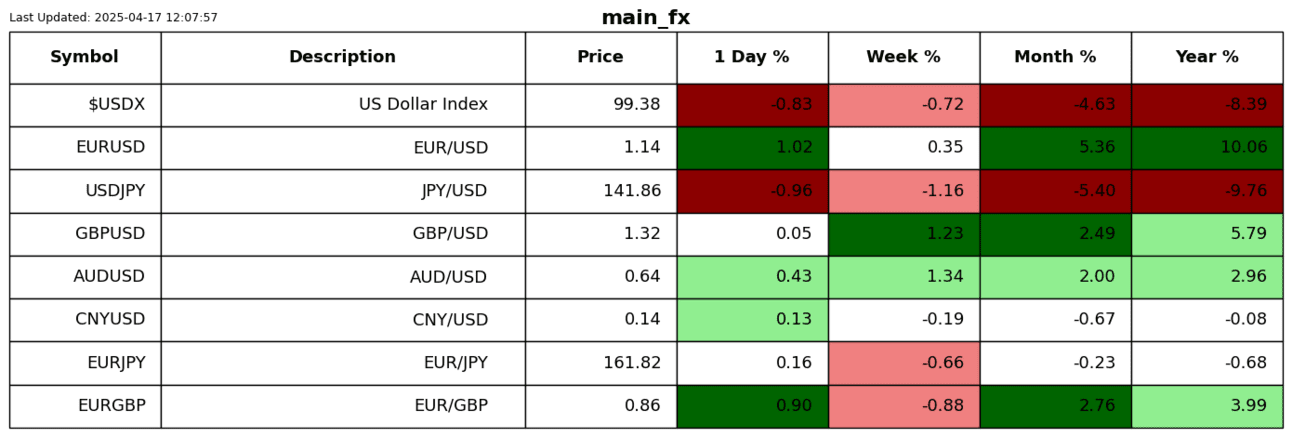
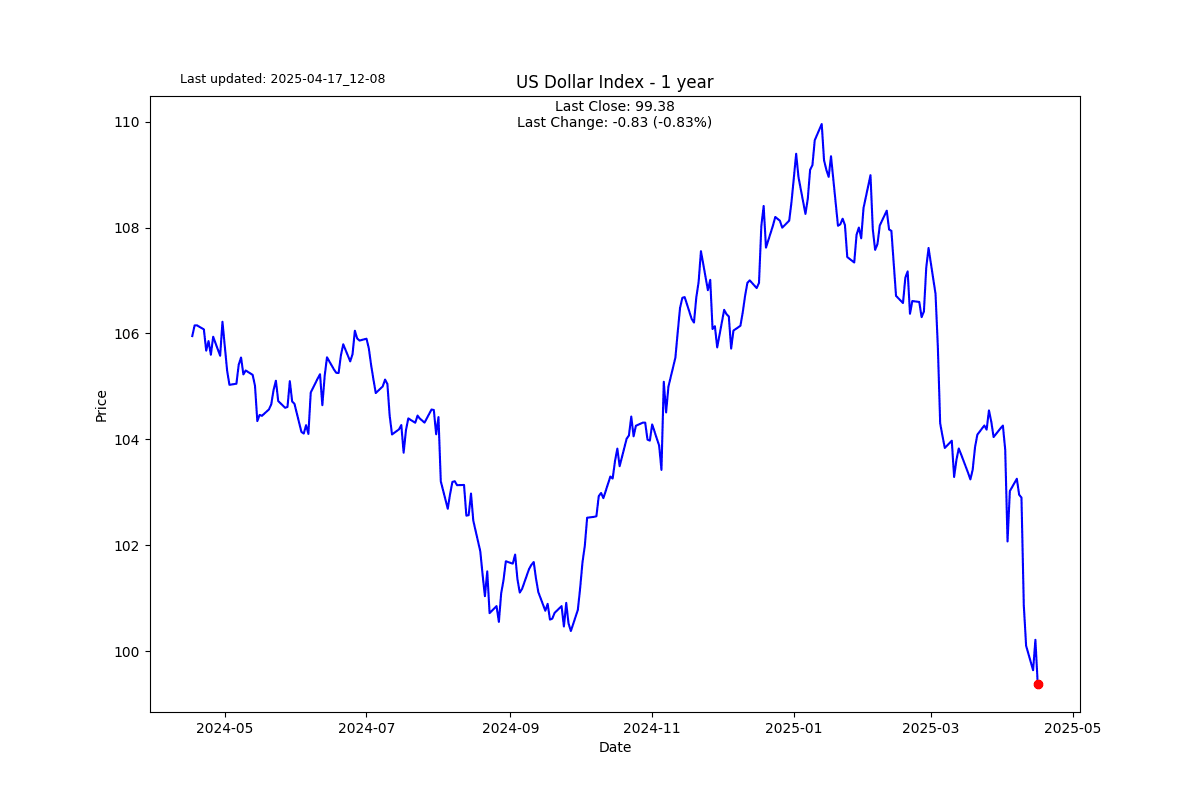
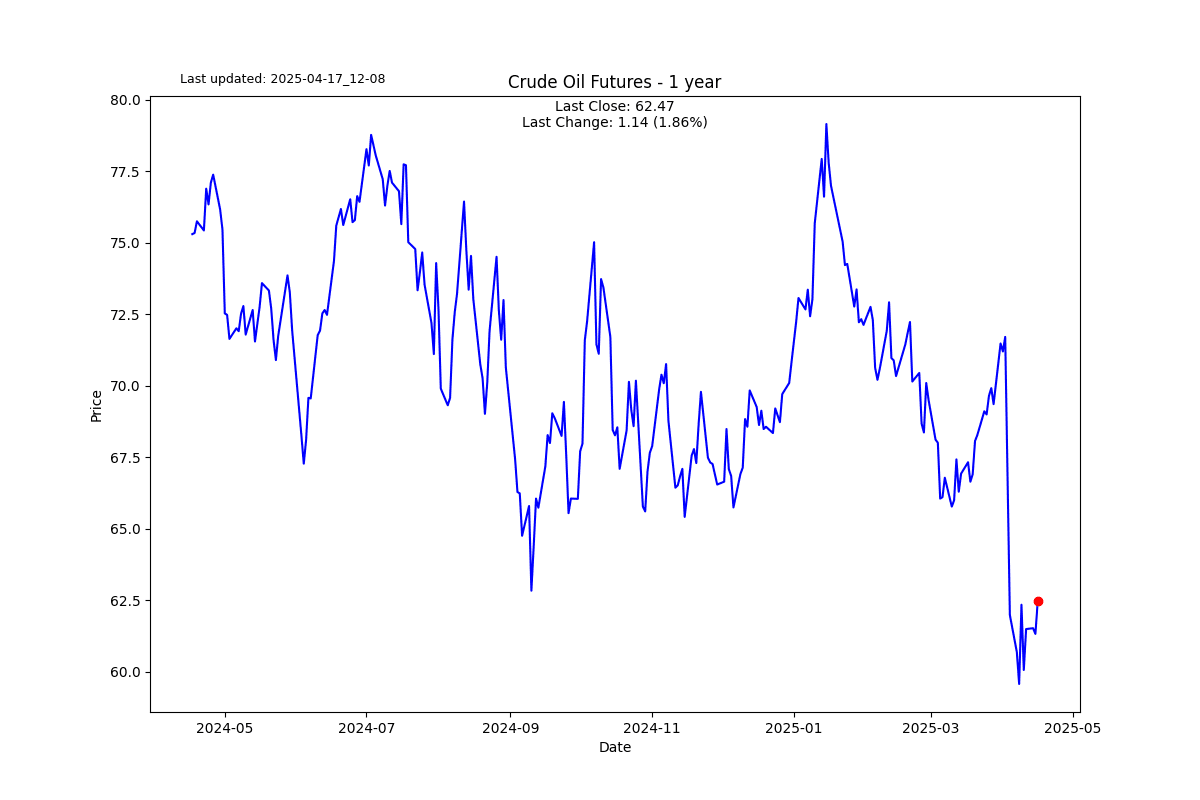
Wow, this is one of the “softest” charts I have seen in a long time. Speaking technically, I don’t know how you could buy this chart. I would be looking to sell the dollar on any strength.
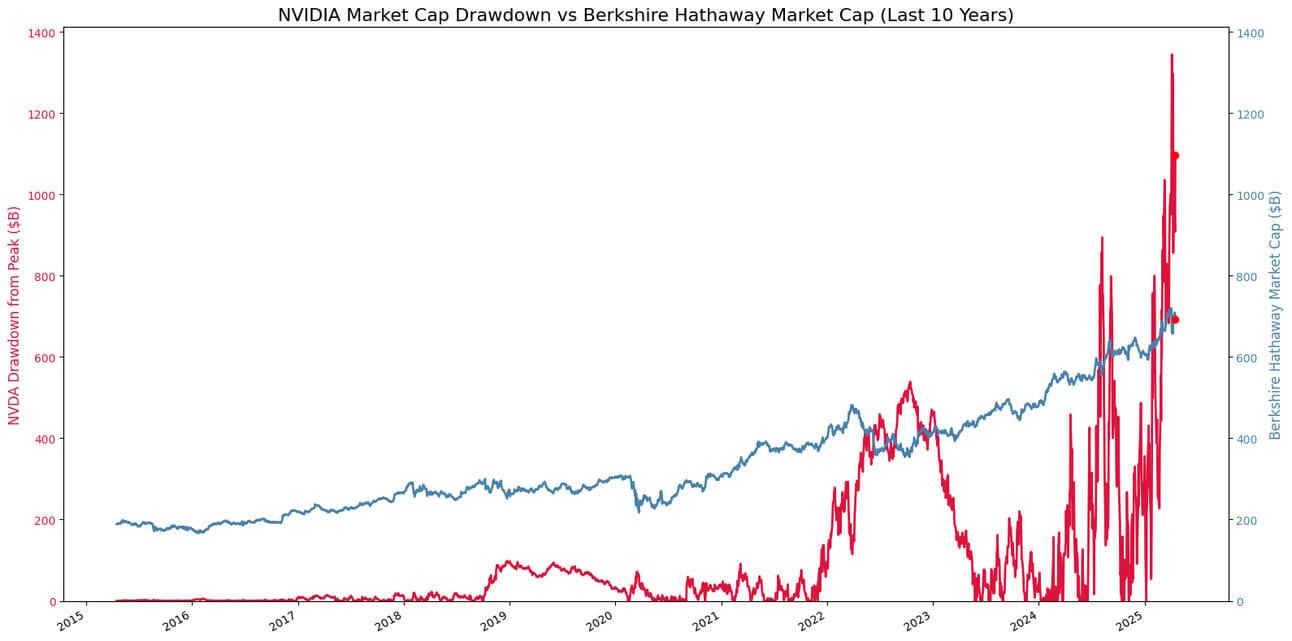
To get a sense of the size of NVIDIA, you can see in this chart the current drawdown in dollars inverted against Berkshire Hathaway's market cap. The current drawdown of $1.2 trillion is nearly double the value of Buffett's life's work of $700 billion.
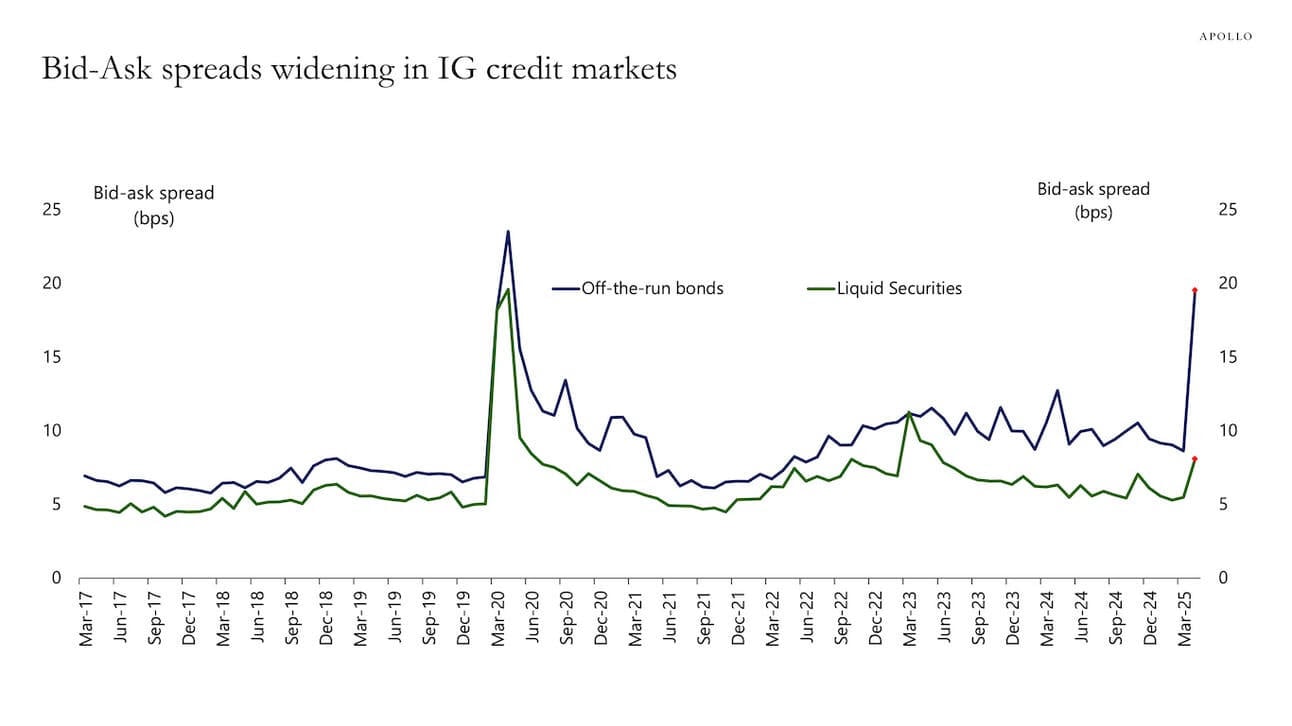
I have been speaking of the low spreads for junk debt for some time. The cracks are starting to appear. I follow Torsten Slok closely. I have been showing the green chart from time to time. Dr. Slok has adjusted those prices by the bid-ask spread, which is showing a huge spike from the Liberation Day shenanigans.
Hedge fund manager Steven Grey had this to say about a section of the debt market that doesn’t get featured in the media too often.
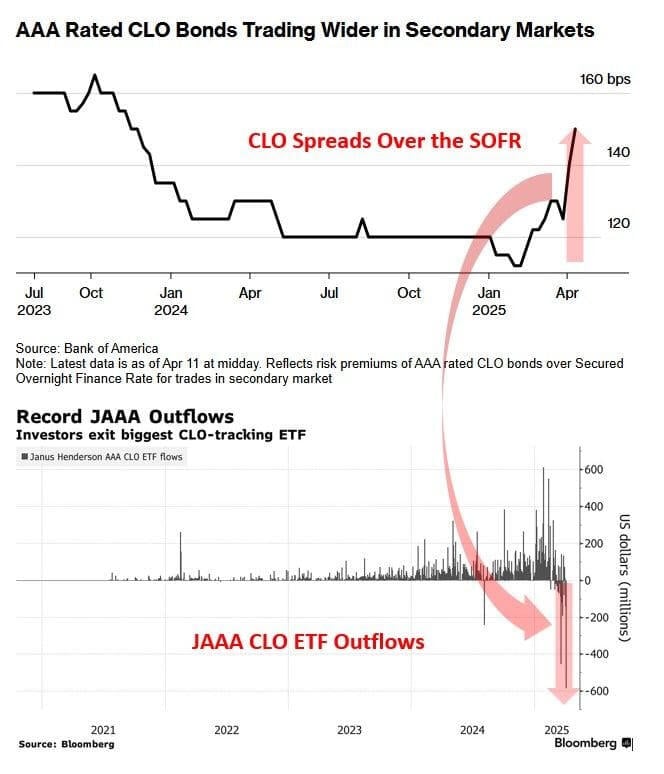
CLOs are Cracking: Welcome to the World of Unintended Consequences.
A big selloff of existing collateralized loan obligations (CLOs), which buy and pool buyout debt, has slowed the issuance of new CLOs.
This makes sense - because the selloff pushed down the prices of existing CLOs, that's what investors will buy until issuers price new CLOs more attractively.
This in turn has created a headache for banks looking to offload buyout debt they would have gotten off of their balance sheets by repackaging it into new CLOs.
This is not a minor issue; CLOs are a ~$1.4 trillion market.
S2N screener alert
It is gold’s day. It is only the 30th time it has traded above 3.45% in 43 years.
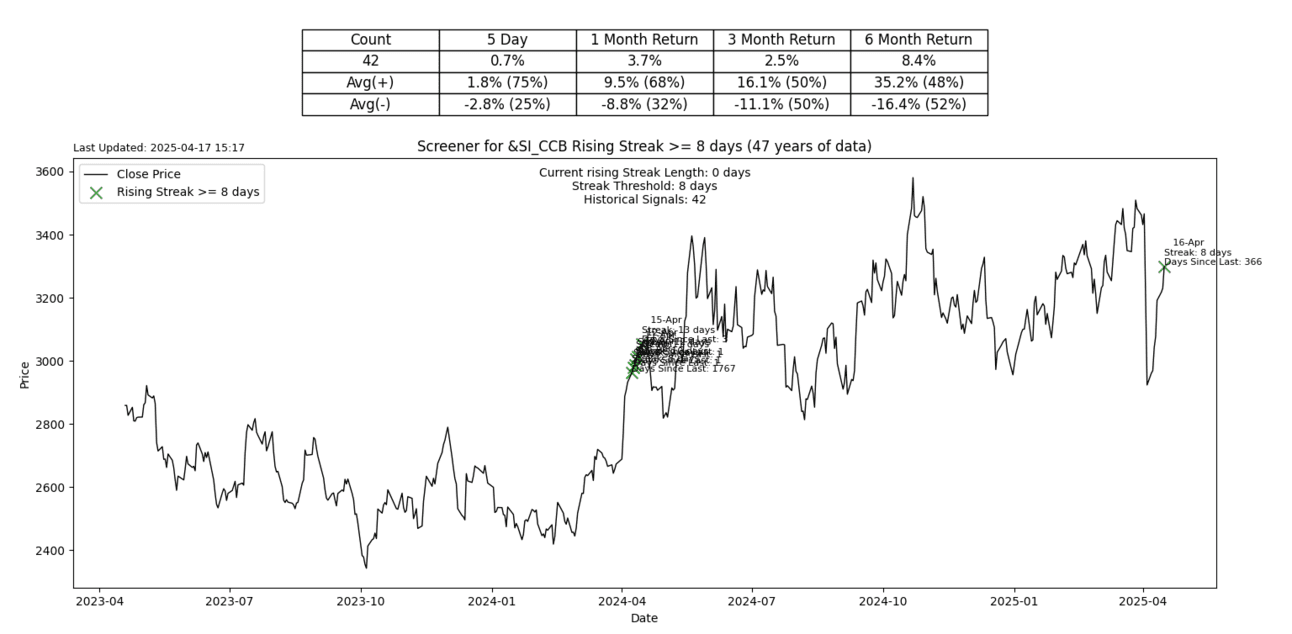
Silver rallied for its 8th day in a row. Been here 42 times before.
S2N performance review
S2N chart gallery
S2N news today
Author

Michael Berman, PhD
Signal2Noise (S2N) News
Michael has decades of experience as a professional trader, hedge fund manager and incubator of emerging traders.


