Four factors to consider in the forex market

Outlook:
There is a 4th factor at work in FX and we can’t pin it down yet. Factor #1 is multiple trade wars started by Trump and their ebb and flow. Breakdown in talks = rise in risk aversion and the dollar. Resumption of talks = reduction in risk aversion but not always a corresponding and proportional drop in the dollar.
Factor No. 2: Fed rate cut in July, then another in September and a third in December, with maybe a fourth in there somewhere or one of the occasions delivering 50 bp instead of the regular 25 bp. This factor is dollar negative all the way, although at some point you expect the July cut to be fully priced in. Nothing happened over the past few days to change the outlook for at least one or two cuts and yet the dollar held gains. Huh?
Factor No. 3: big player positioning. This is always a wild card in FX because deals are private and we get zero information on volume. If you like the Commitment of Traders for its implied volume in futures, go ahead and use it, but the data comes out on a Friday for the previous Tuesday and by the time you have figured out the holy messy of the data, it’s already the next week. And it’s futures, a big number in total volume but still less than 5% of the spot market. We know the big boys are taking action when we see gaps, spikes, and other oddball bars. We haven’t had much oddball in the USD/EUR but lately we sure do see weird things in the AUD, yen and Swiss franc.
What is Factor No. 4? We guess it might have something to do with the dollar de-coupling from the new conventional viewpoint of giant rate cuts taking the 10-year down at the same extent. This is not how the 10-year works. What is the relationship between the Fed funds rate and the 10-year, anyway?
We bet you can’t come up with a quick answer. We couldn’t either and had to go look for some data. We found a paper at the St. Louis Fed that offers the chart below and says “As we can see, the fed funds rate and the one-year Treasury rate track each other very closely. Although it is still debatable whether the Fed leads or follows the market, movements in the policy rate are associated with similar movements in short-term interest rates.2
“In contrast, the interest rate on a 10-year Treasury bond does not appear to move as closely with the fed funds rate. While there appears to be some co-movement, the 10-year interest rate appears to follow its own declining path.”
Eureka! Maybe that’s Factor No. 4. Let’s assume we get one cut in July. That takes the Fed funds rate from 2.25-2.50% to 2.00-2.25% and there is a 74% probability of that outcome, according to CME futures. Okay, what effect should that single move have on the 10-year? Aside from crises, the 10-year tends to be at least 1% more than Fed funds. Or is it? See the chart from the St. Louis Fed.
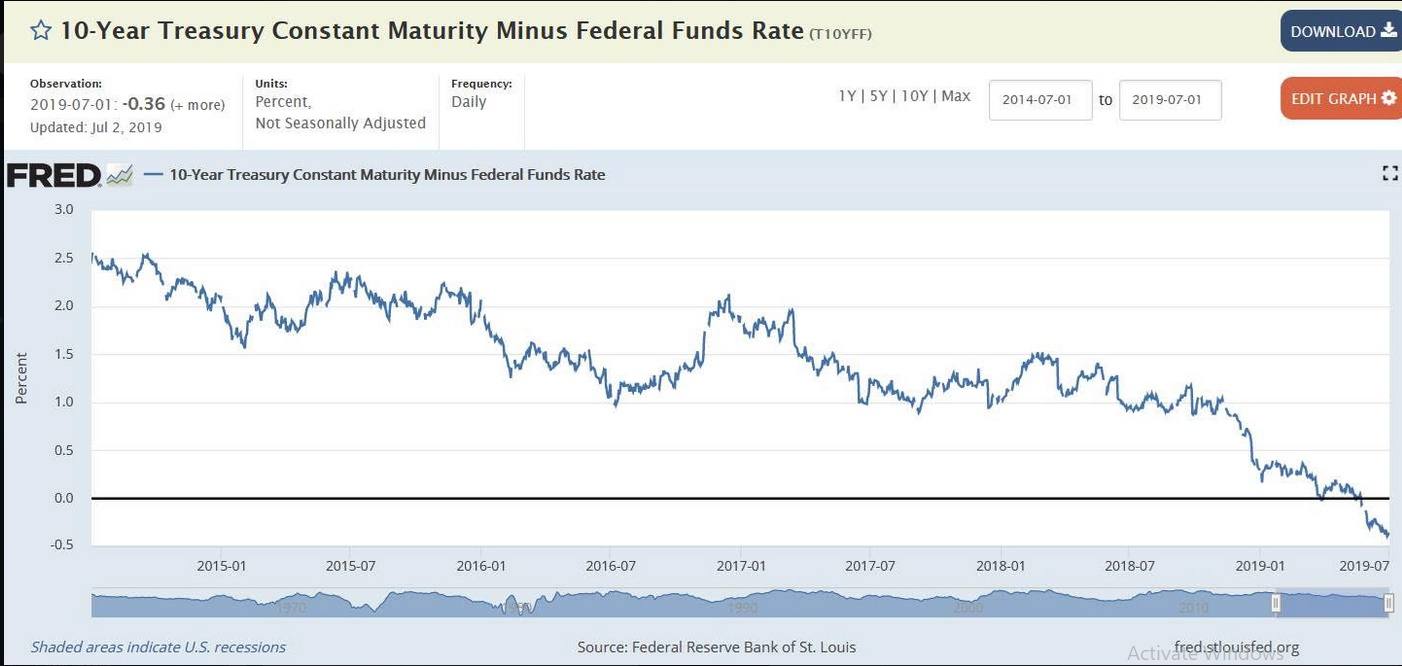
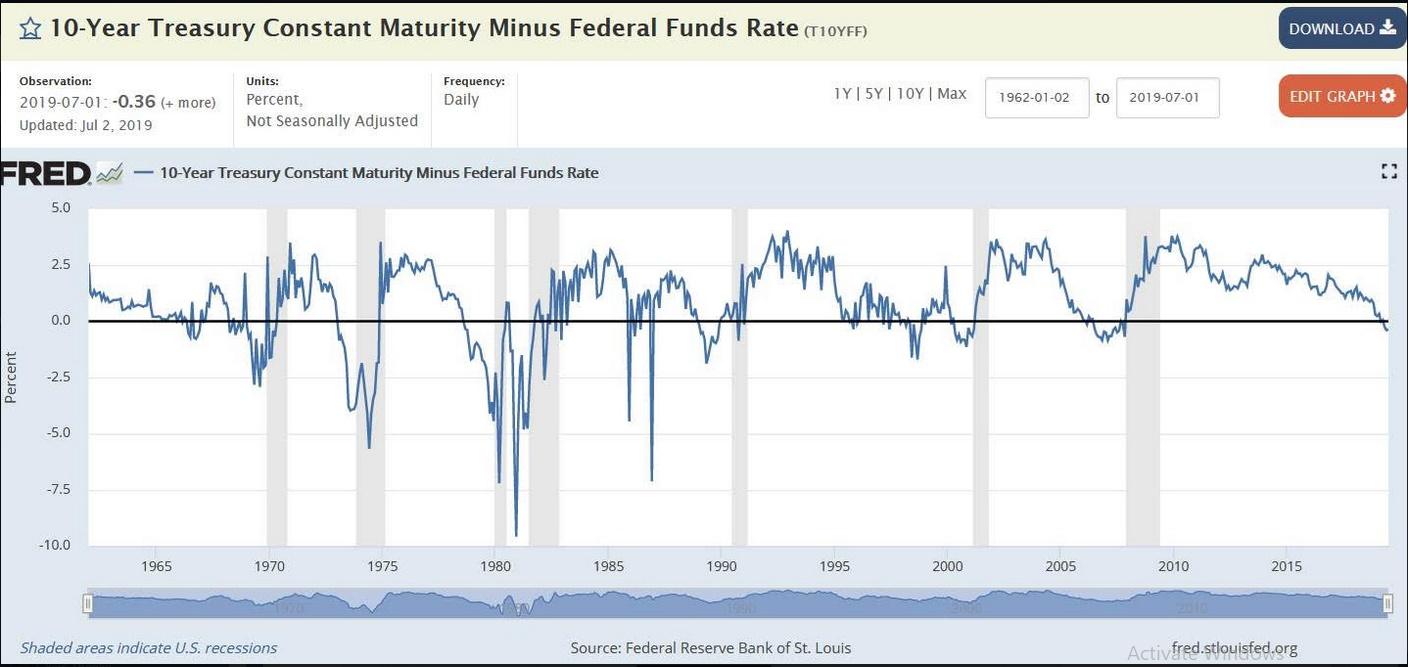
Good grief, what is going on? The yield diff between Fed funds and the 10-year shrinks from 2.5% in 2015 to below zero by June 2019. That implies the bond gang is expecting a crisis. See the next chart, which is the same thing expanded to go back a whole lot more years. Before now, we had that negative differential in Nov 2006, Nov 2002, September 1998—if you are old enough, you can instantly name the cause of those oddball outcomes.
So, Factor 4 has two parts: the first part pertains to the 10-year not moving pari passu with Fed funds, so chatter of three or four cuts does not have the implications some are attributing to it. You can’t just add up 1% in Fed funds cuts and apply it wholesale to Treasuries and get 2-1% = 1%. But when there is a crisis, the 10-year yield can be below Fed funds. This spells doom for all kinds of things, including the dollar. Take the 1980 occasion. The dollar tanked for a full five years to 1985. That’s the period when the dollar/yen went to 76 and the Emperor’s Palace was worth more than California. We can’t immediately line up every instance of a negative return to specific currency events, but we could make a darn good effort. There is a correlation here.
So then the question becomes whether this current dip into negativity is justified. Well, it is if you think Trump is ruining the world. Bloomberg notes mass confusion and quotes a Pimco advisor who says “We had a rally in both risk-free and risk assets. Both are priced to perfection. We have a fixed-income market priced in between heaven and hell.” Bloomberg interprets: “For heaven, read a combination of dovish monetary policy and trade-war resolution that gives the business cycle extra juice. For hell, brace for a prolonged trade war, faltering growth and impotent central bankers.”
The S&P gives a zero probability of recession (JPMorgan Chase model), while “U.S. junk bond spreads indicate just an 8% likelihood. The Treasury market puts the probability at 62%.” Chief fixed income expert at HSBC, Steven Major, says all these forecasts of the 10-year yield down to 0.65% are way overdone. He is sticking to 2.1% at year-end, actually a tad higher than what we have now.
We like Major for the simple fact that it’s obvious the rate cut enthusiasts have gone overboard—three or four cuts this year—and on practically no evidence that conditions are dire enough to justify it. Conditions are dire in some sectors and some industries, but overall, we’re all right, Jack. That Trump wants 4% when 2% is about right for extending the expansion should not be driving hysteria on the bond desk. What Major is saying is that a drop in yields is not warranted. We might extrapolate and say that if Fed funds is lowered too much, we get a reflexivity effect and a drop in the 10-year that is not warranted and also very dangerous. This is Cleveland Fed Pres Mester’s argument and it’s not a bad one. The Cleveland Fed has a bit of a reputation for unorthodox thinking. Thank goodness.
So, what does the bond market see that has taken the 10-year yield below Fed funds? A lot of analysts talk about it but nobody has a reasonable and acceptable story. At a guess, this is what is feeding uncertainty and the sense of risk out there somewhere lurking behind a tree and about to hit us over the head.
Note to Readers: Remember July 4 is a national holiday in the US. We will not publish and reports. And we will take a holiday on Friday, as well—like a large proportion of the US. Market activity will be thin to nonexistent, so it’s a good opportunity to sleep past 5.
This is an excerpt from “The Rockefeller Morning Briefing,” which is far larger (about 10 pages). The Briefing has been published every day for over 25 years and represents experienced analysis and insight. The report offers deep background and is not intended to guide FX trading. Rockefeller produces other reports (in spot and futures) for trading purposes.
To get a free trial, please write to [email protected] and you will be added to the mailing list..
This is an excerpt from “The Rockefeller Morning Briefing,” which is far larger (about 10 pages). The Briefing has been published every day for over 25 years and represents experienced analysis and insight. The report offers deep background and is not intended to guide FX trading. Rockefeller produces other reports (in spot and futures) for trading purposes.
To get a two-week trial of the full reports plus traders advice for only $3.95. Click here!
Author

Barbara Rockefeller
Rockefeller Treasury Services, Inc.
Experience Before founding Rockefeller Treasury, Barbara worked at Citibank and other banks as a risk manager, new product developer (Cititrend), FX trader, advisor and loan officer. Miss Rockefeller is engaged to perform FX-relat