EUR/USD, “Euro vs US Dollar”

Having finished the ascending wave at 1.0086, EURUSD is forming a new consolidation range around this level. If later the price breaks the range to the upside, the market may start another growth to reach 1.0151, or even extend this structure up to 1.0219; if to the downside – resume moving within the downtrend with the target at 1.0018.

Chart

GBP/USD, “Great Britain Pound vs US Dollar”

After completing the ascending wave at 1.1900, GBPUSD is expected to fall to break 1.1824 and then continue trading downwards to reach 1.1744. On the other hand, if the price grows and breaks 1.1900, the market may start another growth with the target at 1.2055.

Chart

USD/JPY, “US Dollar vs Japanese Yen”

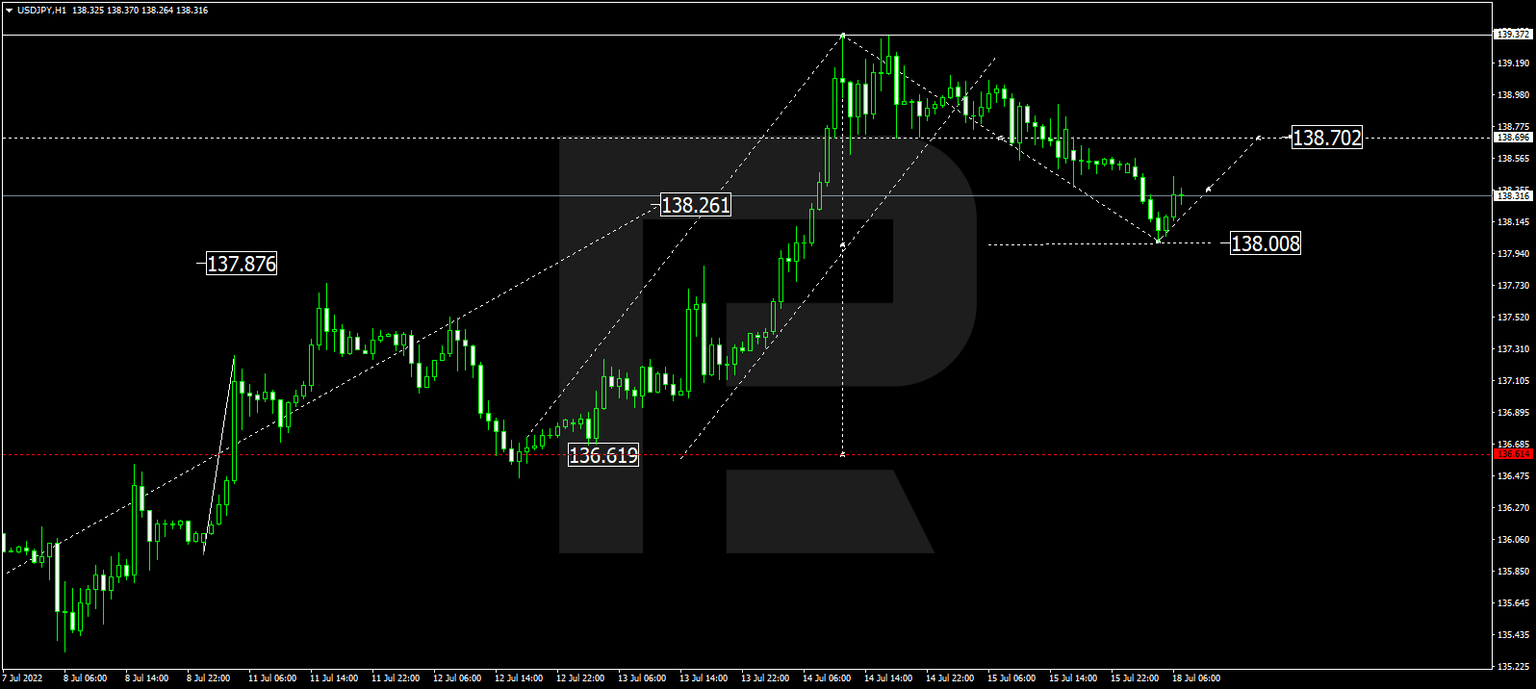
USDJPY has finished the descending structure at 138.02 and may later grow towards 138.70, thus forming a new consolidation range between these two levels. If the price breaks the range to the upside, the market may resume growing with the target at 140.00; if to the downside – start a new decline to reach 136.66.

Chart

USD/CHF, “US Dollar vs Swiss Franc”

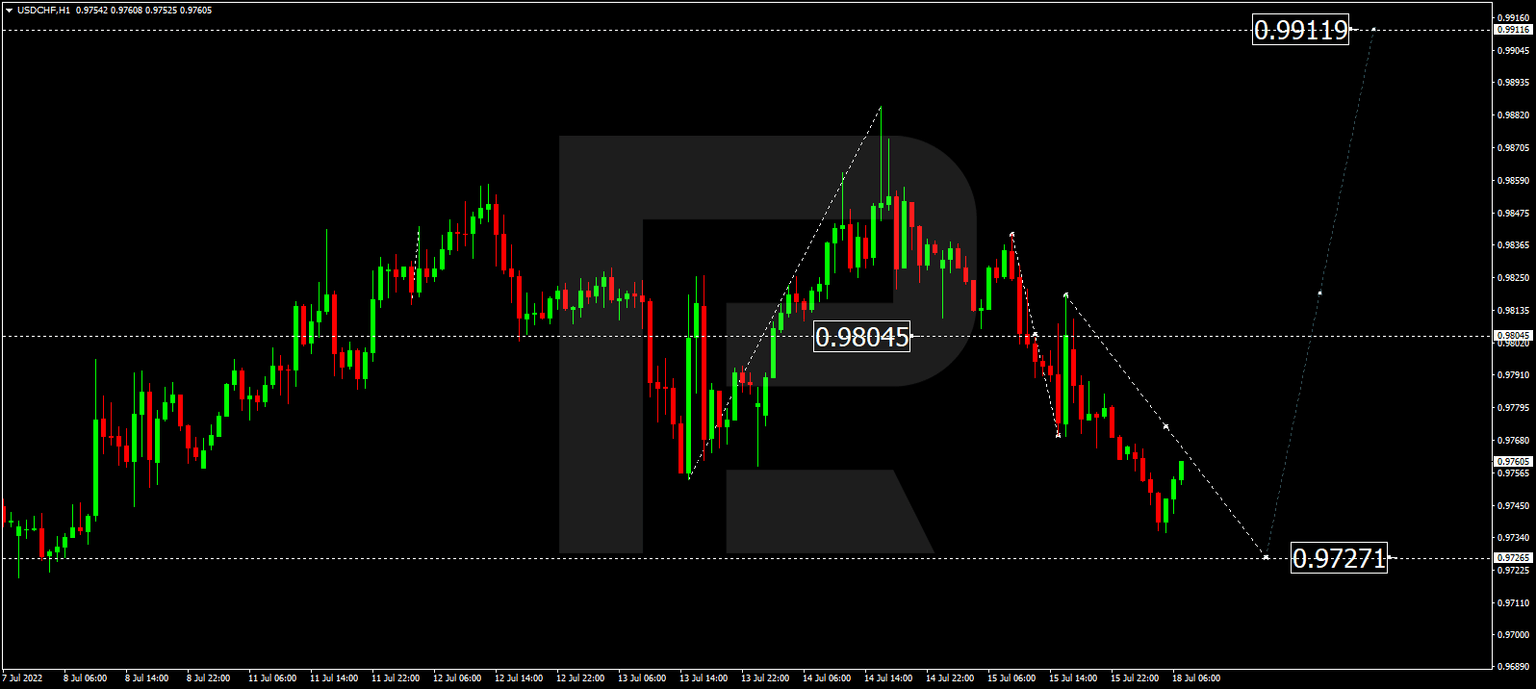
USDCHF is still falling towards 0.9727. After that, the instrument may resume trading upwards with the target at 0.9911.

Chart

AUD/USD, “Australian Dollar vs US Dollar”

AUDUSD has finished the ascending wave at 0.6817. Today, the pair may resume falling to reach 0.6762 and then start a new growth with the target at 0.6842. Later, the market may form another descending wave towards 0.6660.

Chart

Brent

Brent is still consolidating above 101.78. Possibly, the asset may form one more ascending structure towards 104.35, and then resume falling to return to 101.78. After that, the instrument may start another growth with the first target at 108.00.

Chart

XAU/USD, “Gold vs US Dollar”

Gold continues consolidating above 1700.27. If the price breaks the range to the upside, the market may resume growing with the target at 1767.44; if to the downside – start a new decline to reach 1688.15, and then form one more ascending structure towards the above-mentioned target.

Chart

S&P 500

The S&P index has finished the ascending structure at 3865.0; right now, it is consolidating this level. If later the price breaks the range to the upside, the market may resume growing to reach 4004.0. After that, the instrument may start a new decline to return to 3865.0 and then form one more ascending structure with the target at 4100.0.

Chart

Before you enter foreign exchange and stock markets, you have to remember that trading currencies and other investment products is trading in nature and always involves a considerable risk. As a result of various financial fluctuations, you may not only significantly increase your capital, but also lose it completely. Therefore, our clients have to assure RoboForex that they understand all the possible consequences of such risks, they know all the specifics, rules and regulations governing the use of investment products, including corporate events, resulting in the change of underlying assets. Client understands that there are special risks and features that affect prices, exchange rates and investment products.

Recommended Content


Recommended Content

Editors’ Picks

AUD/USD holds steady near 0.6250 ahead of RBA Minutes

AUD/USD holds steady near 0.6250 ahead of RBA Minutes

The AUD/USD pair trades on a flat note around 0.6250 during the early Asian session on Monday. Traders brace for the Reserve Bank of Australia Minutes released on Tuesday for some insight into the interest rate outlook.

AUD/USD News
USD/JPY consolidates around 156.50 area; bullish bias remains

USD/JPY consolidates around 156.50 area; bullish bias remains

USD/JPY holds steady around the mid-156.00s at the start of a new week and for now, seems to have stalled a modest pullback from the 158.00 neighborhood, or over a five-month top touched on Friday. Doubts over when the BoJ could hike rates again and a positive risk tone undermine the safe-haven JPY. 

USD/JPY News
Gold price bulls seem non-committed around $2,620 amid mixed cues

Gold price bulls seem non-committed around $2,620 amid mixed cues

Gold price struggles to capitalize on last week's goodish bounce from a one-month low and oscillates in a range during the Asian session on Monday. Geopolitical risks and trade war fears support the safe-haven XAU/USD. Meanwhile, the Fed's hawkish shift acts as a tailwind for the elevated US bond yields and a bullish USD, capping the non-yielding yellow metal.

Gold News
Week ahead: No festive cheer for the markets after hawkish Fed

Week ahead: No festive cheer for the markets after hawkish Fed

US and Japanese data in focus as markets wind down for Christmas. Gold and stocks bruised by Fed, but can the US dollar extend its gains? Risk of volatility amid thin trading and Treasury auctions.

Read more
Bank of England stays on hold, but a dovish front is building

Bank of England stays on hold, but a dovish front is building

Bank of England rates were maintained at 4.75% today, in line with expectations. However, the 6-3 vote split sent a moderately dovish signal to markets, prompting some dovish repricing and a weaker pound. We remain more dovish than market pricing for 2025.

Read more
Best Forex Brokers with Low Spreads

Best Forex Brokers with Low Spreads

VERIFIED Low spreads are crucial for reducing trading costs. Explore top Forex brokers offering competitive spreads and high leverage. Compare options for EUR/USD, GBP/USD, USD/JPY, and Gold.

Read More

Majors

Cryptocurrencies

Signatures