Forex market outlook – Weekly charts analysis

The provided document contains weekly charts for five major currency pairs: USD/JPY, NZD/USD, GBP/USD, EUR/USD, and AUD/USD. Each pair is represented by two chart types:
Chart 1: A candlestick chart displaying support and resistance levels.
Chart 2: A candlestick chart with Bollinger Bands and a Z-score indicator.
This analysis will integrate information from both chart types to formulate a comprehensive market outlook for each pair.

USD/JPY (US Dollar/Japanese Yen)
Chart 1 (Support/Resistance): The chart shows a recent and significant bearish move, with the price breaking below a key support level at approximately 142.1835. This breach suggests a potential continuation of the downtrend. The absence of a clearly defined immediate support level below the broken one implies the possibility of further price decline.
Chart 2 (Bollinger Bands/Z-score): The price has moved below the lower Bollinger Band, indicating a potential oversold condition and heightened volatility. The Z-score is deeply negative, reinforcing the oversold state and suggesting that the recent bearish move is statistically significant.
Overall outlook: Bearish. The break of support and the oversold conditions signaled by the Bollinger Bands and a deeply negative Z-score point to continued bearish pressure. Traders should watch for potential consolidation or minor pullbacks, but the dominant trend favors further downside.
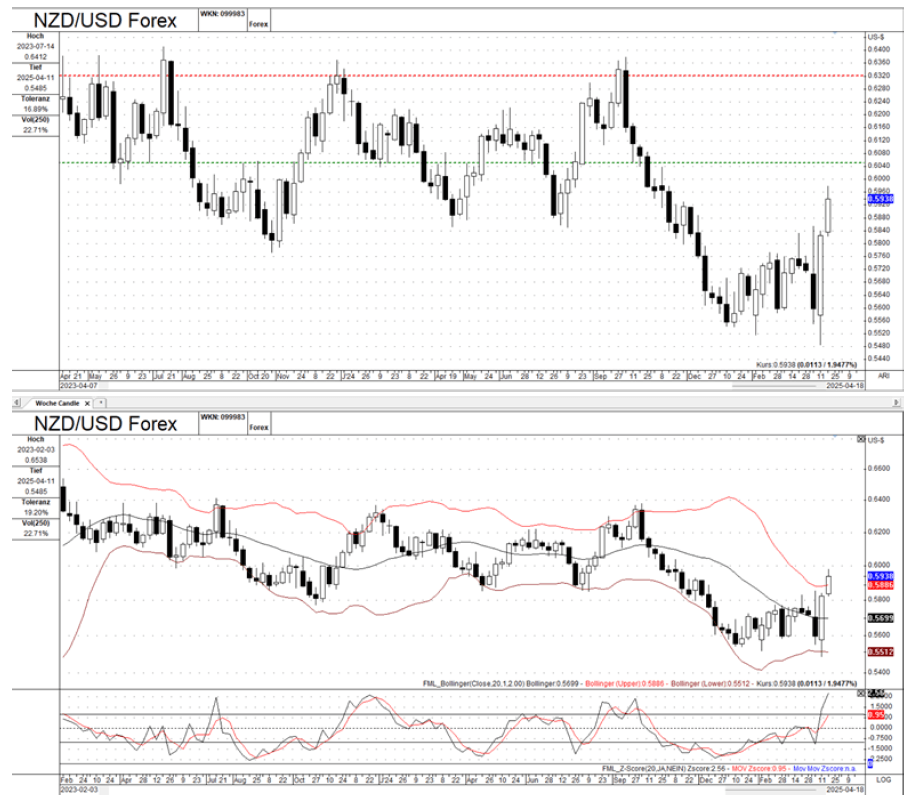
NZD/USD (New Zealand Dollar / US Dollar)
Chart 1 (Support/Resistance): The chart illustrates a prevailing downtrend, with the price recently finding support around 0.5939. Resistance is identified near 0.6332. The overall pattern of lower highs and lower lows confirms the bearish trend.
Chart 2 (Bollinger Bands/Z-score): The price is near the lower Bollinger Band, suggesting oversold conditions. The Z-score is negative, supporting this assessment. However, the Bollinger Bands also indicate continued bearish momentum.
Overall outlook: Bearish with potential for short-term rebounds. While oversold conditions might trigger a temporary bounce, the overarching trend is bearish. Traders should look for selling opportunities during any upward corrections.

GBP/USD (British Pound / US Dollar)
Chart 1 (Support/Resistance): The chart reveals a strong uptrend, with the price having broken through resistance at approximately 1.2377. This breakout suggests bullish momentum, and the pair is making higher highs and higher lows. Support is established around 1.2377 and a more distant level around 1.0750.
Chart 2 (Bollinger Bands/Z-score): The price is trading near the upper Bollinger Band, which can indicate overbought conditions. The Z-score is significantly positive, further supporting the overbought assessment. The widening of Bollinger Bands signifies high volatility in the bullish direction.
Overall outlook: Bullish but with caution. The pair exhibits a strong uptrend, but the overbought signals from the Bollinger Bands and the high positive Z-score suggest a potential pullback. Traders should remain bullish but be prepared for corrective moves.

EUR/USD (Euro / US Dollar)
Chart 1 (Support/Resistance): The chart indicates a clear uptrend, with the price breaking the resistance level of 1.1394. This breakout signifies strong bullish momentum. Support is observed around 1.0850.
Chart 2 (Bollinger Bands/Z-score): The price is trading above the upper Bollinger Band, indicating overbought conditions. The Z-score is highly positive, reinforcing this overbought state.
Overall outlook: Bullish but overextended. The pair is in a strong uptrend, but the overbought readings from both the Bollinger Bands and the Z-score suggest a high probability of a pullback. Traders should look for buying opportunities on dips.

AUD/USD (Australian Dollar / US Dollar)
Chart 1 (Support/Resistance): The chart displays a downtrend, with the price recently rebounding from support at 0.6377. Resistance is located around 0.6840. The overall trend remains bearish.
Chart 2 (Bollinger Bands/Z-score): The price is below the middle Bollinger Band, indicating bearish momentum. The Z-score is negative, supporting the bearish sentiment.
Overall outlook: Bearish. The pair is in a downtrend, and the negative Z-score confirms the bearish momentum. Traders should favor short positions.
Author

FxPro Traders Research Team
FxPro Traders
The FxPro Traders Research Team delivers advanced analysis and strategies designed to empower your success in today's dynamic forex markets.


