Forex: A new era for Euro bulls?

You usually get one really good long term position per year - depending on how many markets you trade.
Across the most popular CFDs including forex, indices, commodities, crypto and blue chip stocks - there are lots of possibilities.
Last year it was gold and US stocks.
We think that the big trade that’s setting up for 2025 could be the euro.
As usual, that view could be completely wrong - or just take much longer to happen than we thought - so we will have our downside risk well defined on any trades.
This view is mostly formed - of course- by the charts. The euro is testing major break out levels across several crosses. In some cases going from bearish to bullish, in others from sideways to bullish. These breakouts have mostly not happened yet - but we are preparing for them.
We don’t need a fundamental catalyst to take these long term views because very often the fundamental case for taking a position isn’t clear until afterwards. However, in this case - there has been a major development in the Eurozone that is arguably bullish for the euro.
Germany, Europe’s largest economy has lifted its so-called ‘debt break’ - meaning the German government is getting ready to spend a lot more than it has been in the past few years. The break was introduced by former Chancellor Angela Merkel in 2009 and limited new borrowing to 0.35% of GDP. Now Germany will exempt spending above 1% of GDP on defence and security and will spend 500 billion euros in a new infrastructure fund.
Government spending is part of the formula for calculating GDP. More government spending, all else being equal, means higher GDP. A higher GDP tends to require higher interest rates and is generally positive for the associated currency.
On top of that, the European Union has collectively agreed to increase defense spending. Again more government spending, and the same deal for Eurozone GDP - it looks like it could be heading higher over the long term.
With Donald Trump in the White House, the US dollar will likely chart its own course - we covered EUR/USD in last week’s report (Week 10 of 2025). We think to best capture the bullish euro trade (without having to also trade the US dollar) there are several opportunities with the euro crosses.
This week we are looking at EUR/AUD and EUR/GBP - while also checking in on the Nasdaq (US tech 100 index) given the huge volatility in stock markets.
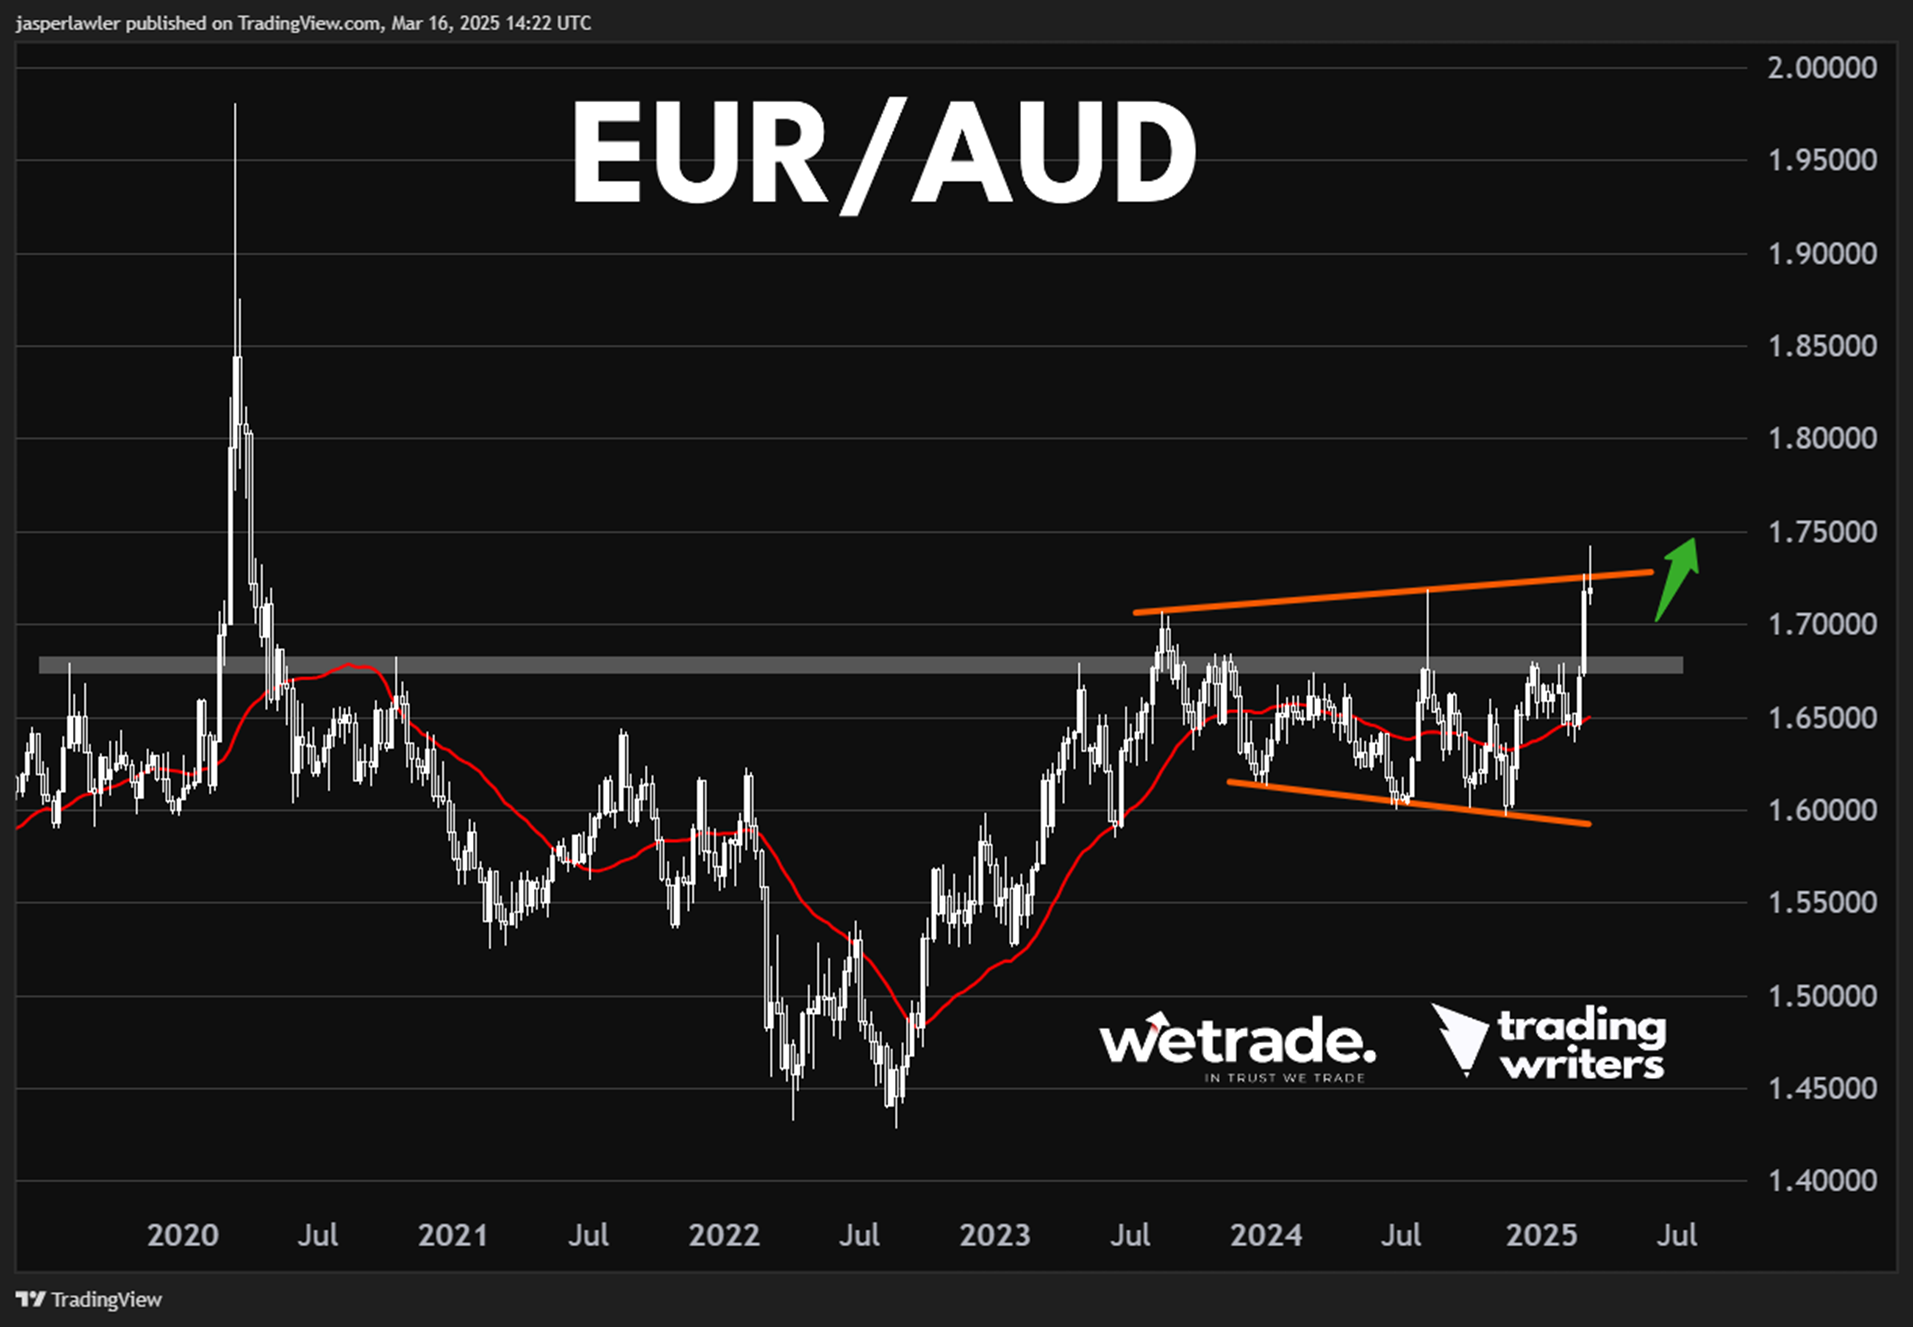
EUR/AUD
Long term chart (weekly)
Trend: Sideways.
Phase: Bullish breakout (bottom).
Resistance = 1.85 (weekly close in 2020).
Support = 1.68 (former long term resistance).
Price action: Last week saw a rejection candle near the top of a wedge pattern, suggesting short term weakness. However the prior week saw the first weekly close above 1.70 since 2020 and looks like a deceive break of the long term resistance (now support) of 1.68.
View: We are bullish whilst the price holds above 1.68.
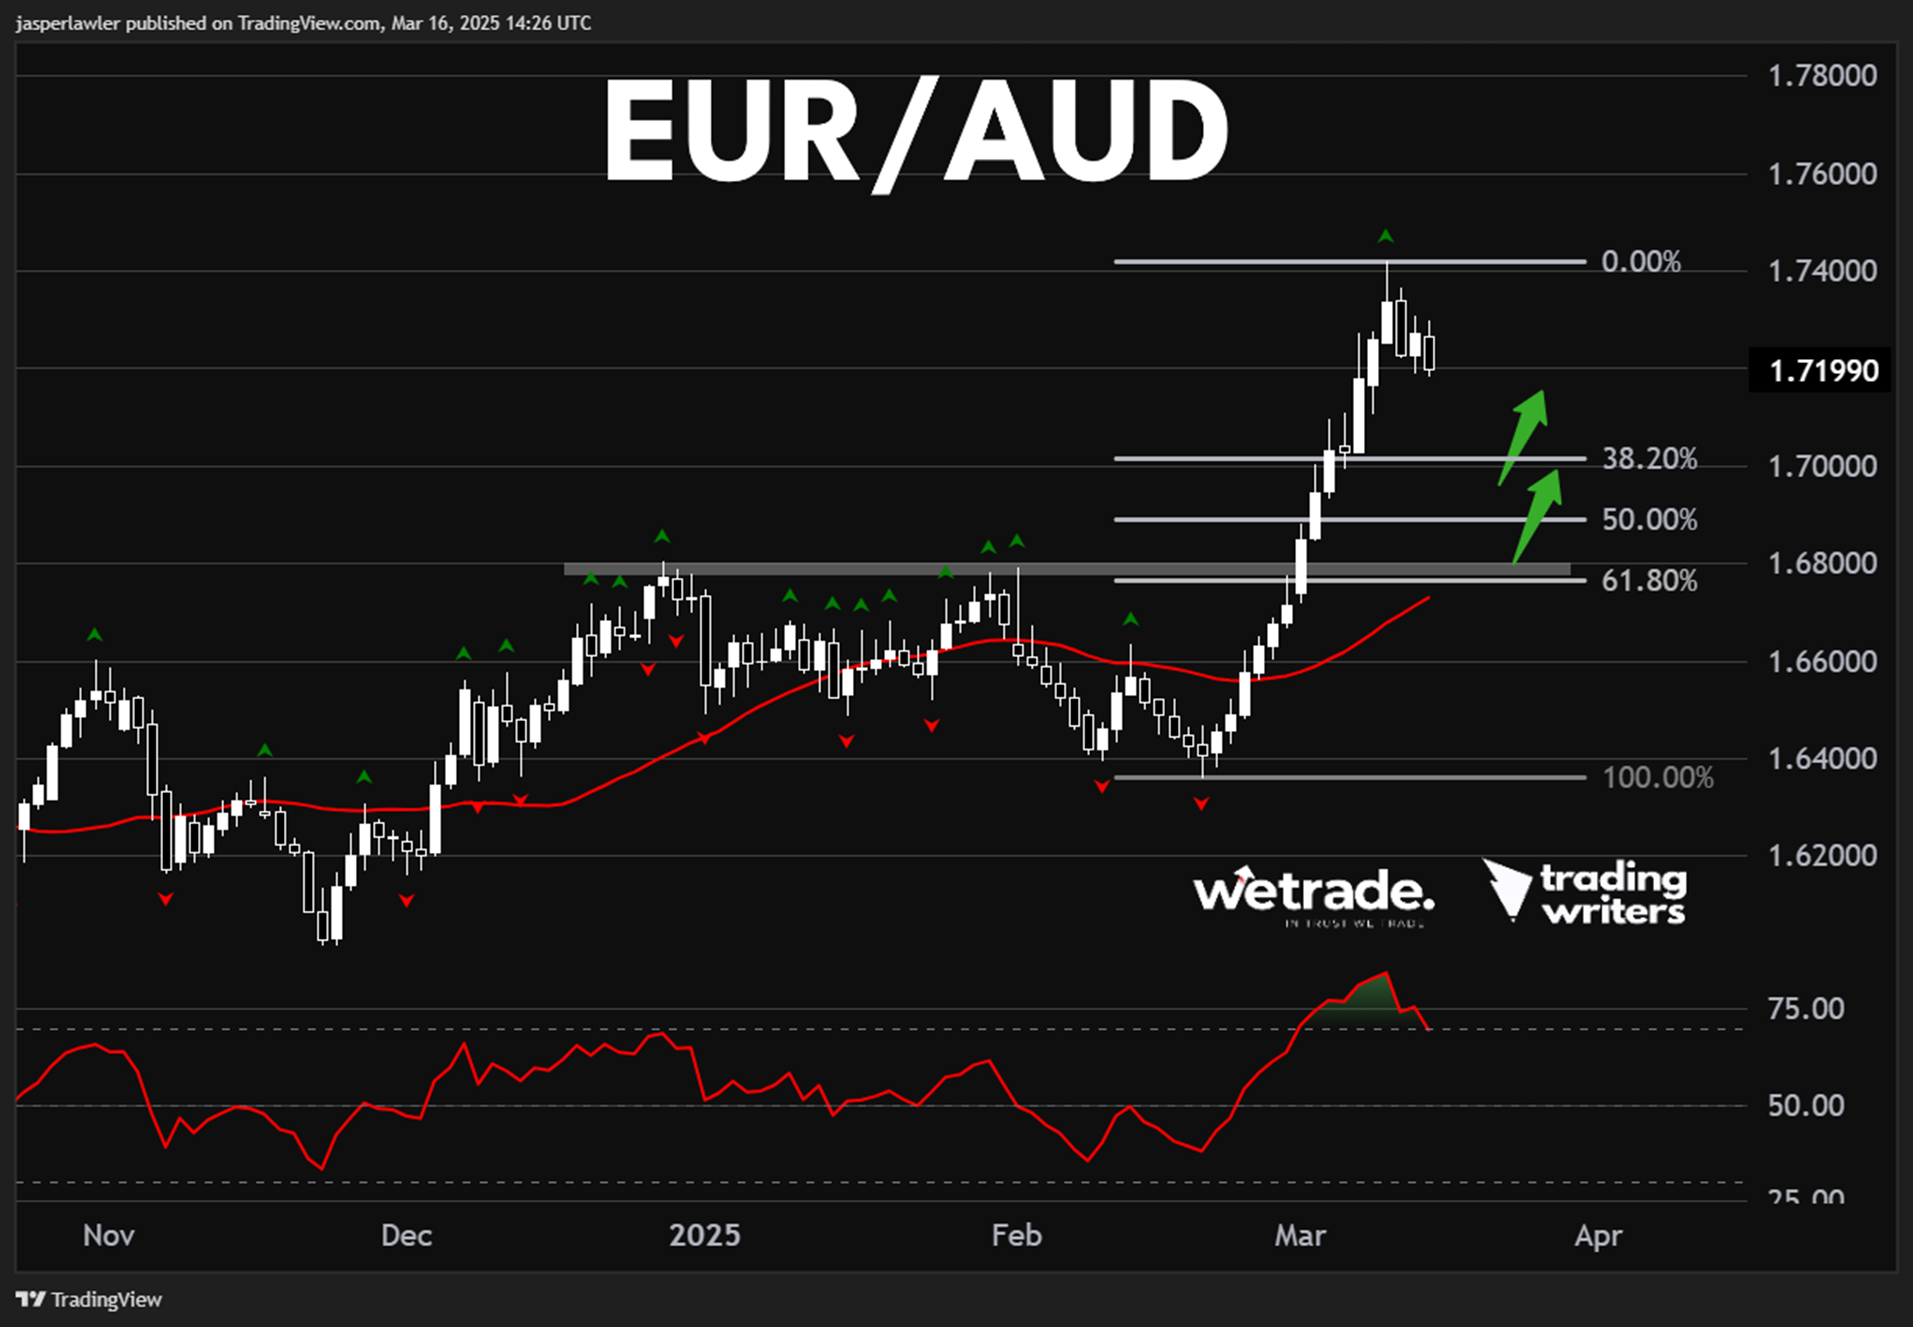
Medium term chart (daily)
Trend: Up.
Phase: pullback.
Resistance = 1.74 (recent high).
Support = 1.70 (round number and 38.2% Fibonacci retracement).
Price action: The price has started to pull back after a massive multi-day upswing. RSI coming out of overbought territory suggests price could drop further. We will be watching the Fib retracement levels as possible entry points to the long term uptrend.
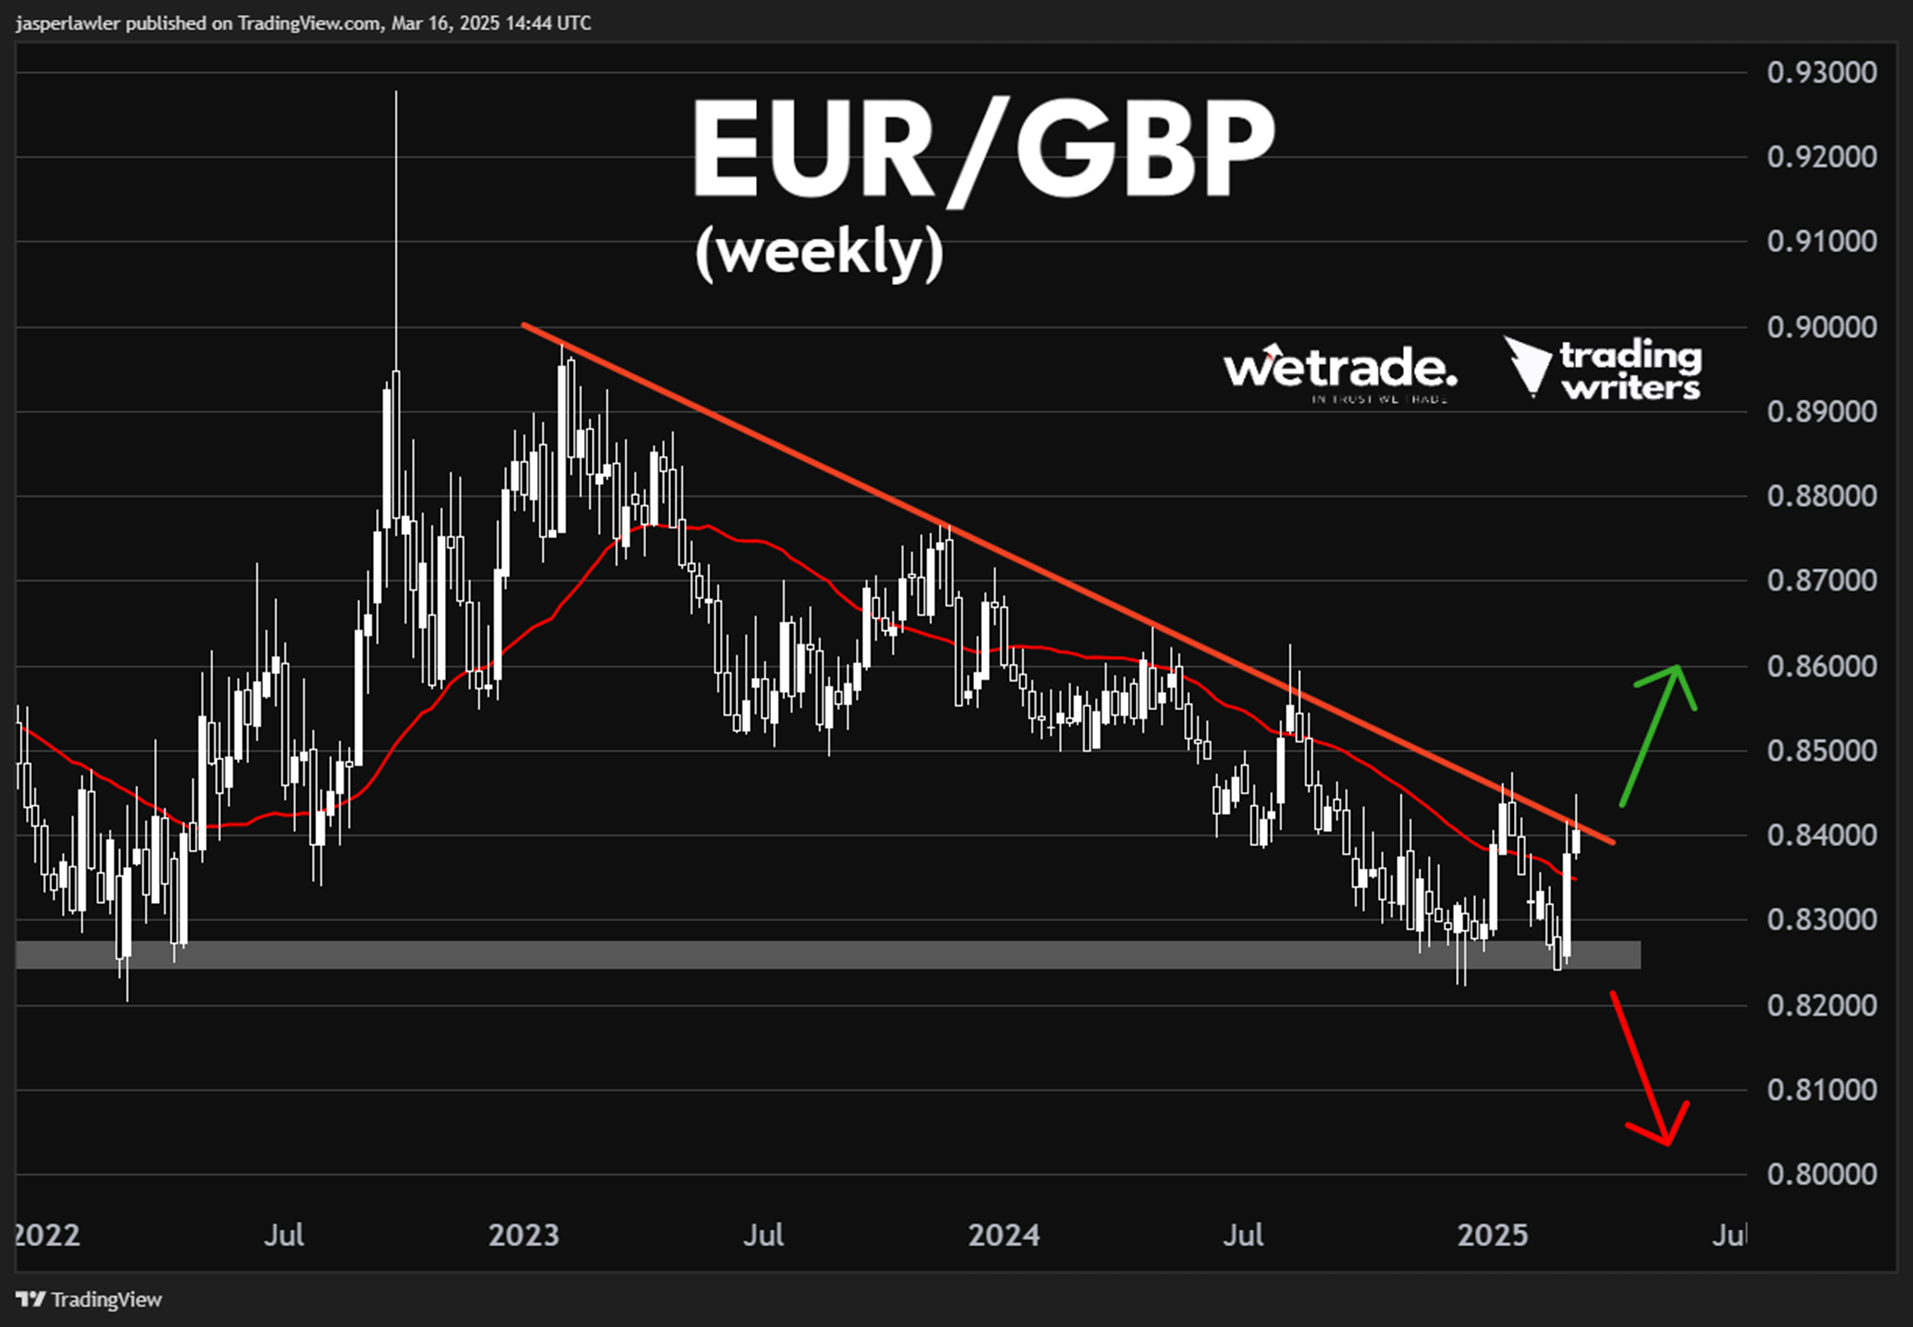
EUR/GBP
Long term chart (weekly).
Trend: Down.
Phase: Possible bottom.
Resistance = 0.875 (range top).
Support = 0.825 (multi-year lows).
Price action: Last week the price was rejected at the long term downtrend line with a wick about the same size as the candle body. We would not consider this a reversal pattern but we would not be surprised to see the price drift lower this week.
View: We will turn bullish after a weekly close above 0.84 and the downtrend line.
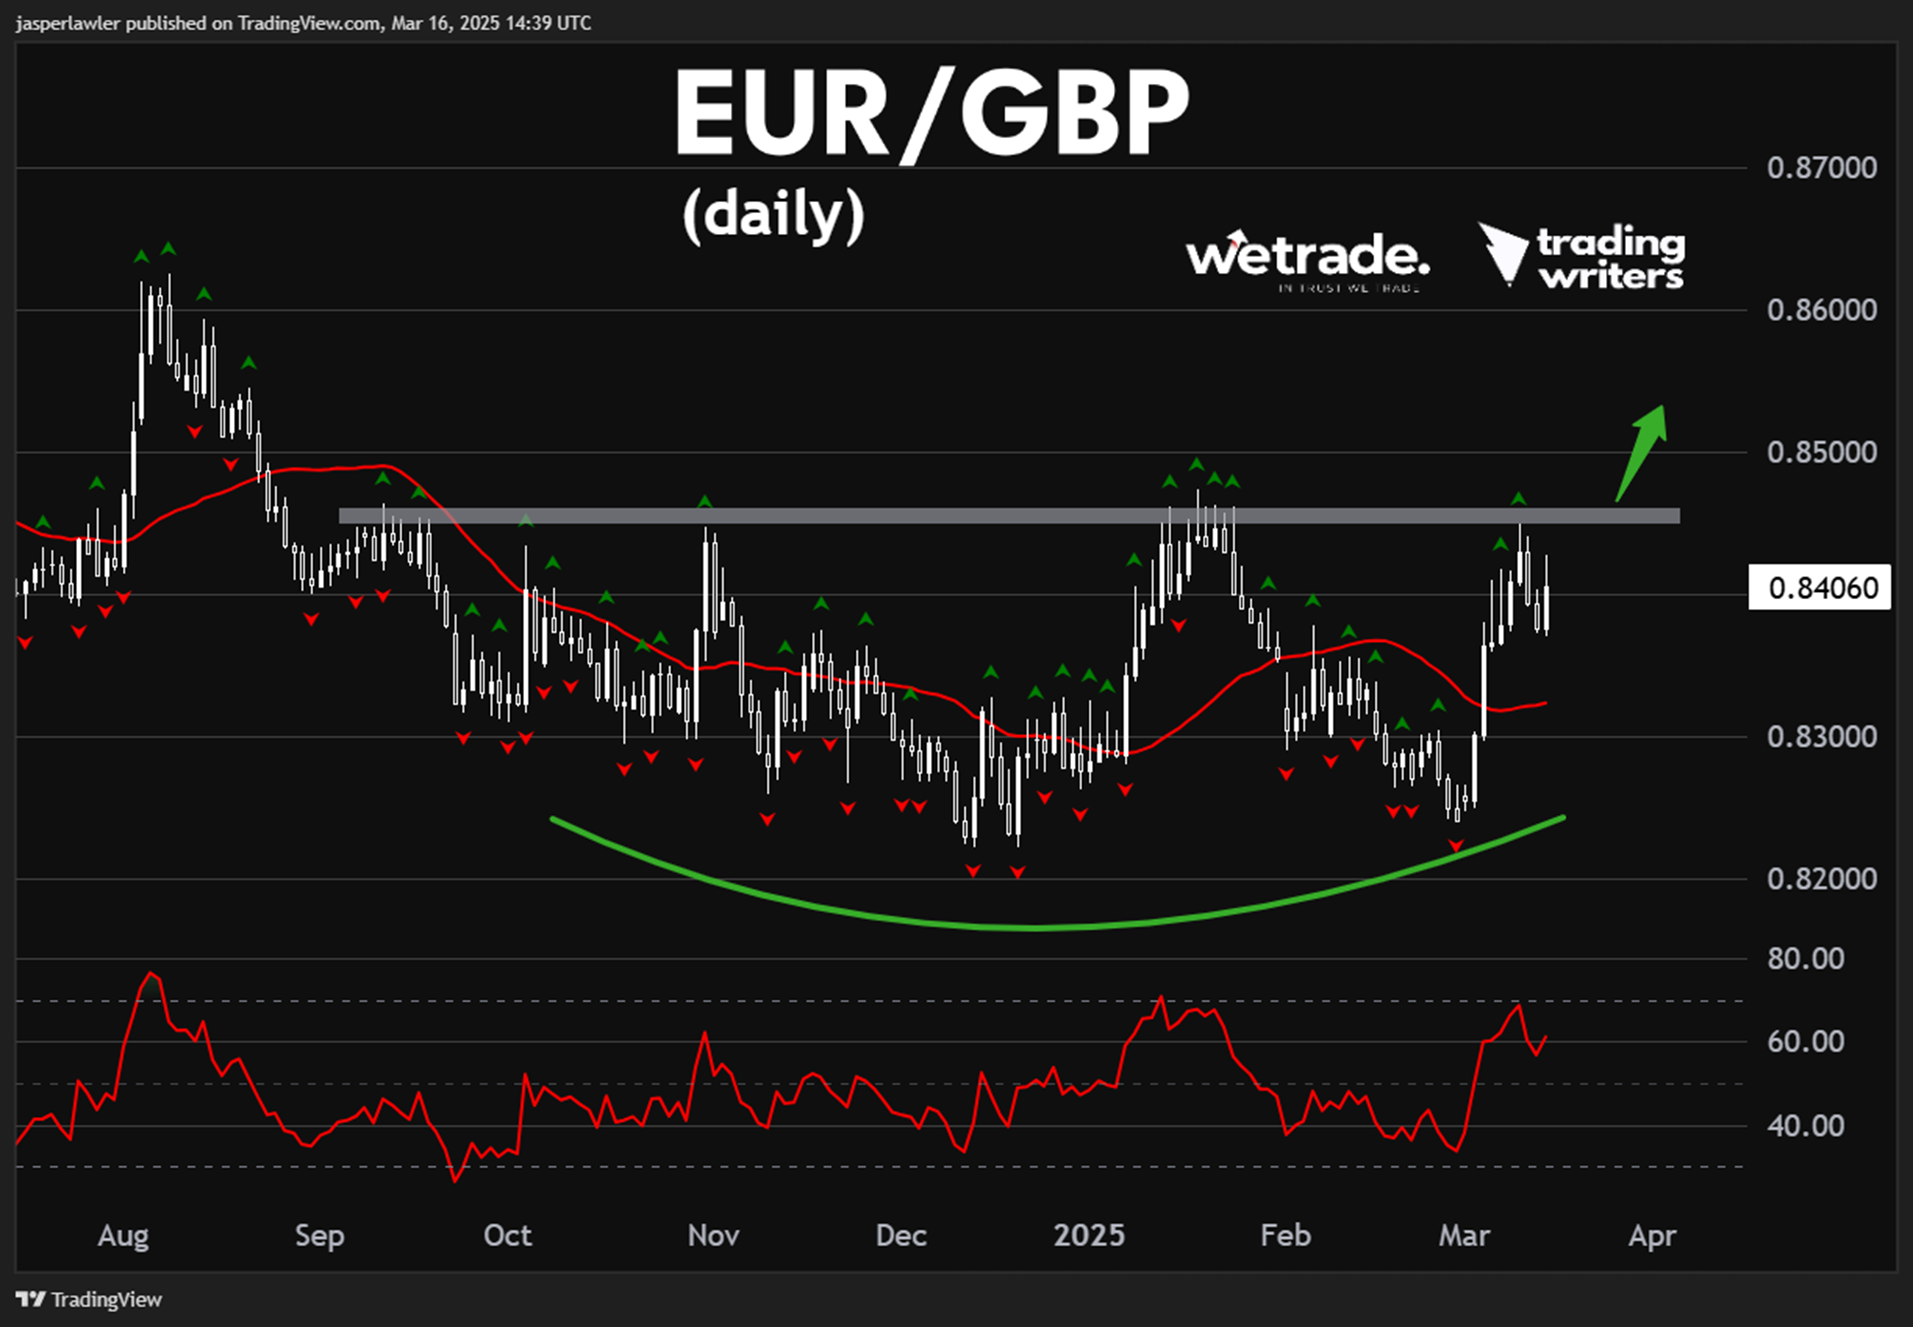
Medium term chart (daily)
Trend: Sideways.
Phase: possible breakout coming.
Resistance = 0.845 (Neckline).
Support = 0.83 (round number).
Price action: Price pulled back from the resistance for two days but closed the week over 0.84, which we consider a bullish development. Our base case is that this is a basing pattern and will result in a bullish breakout. A break back under 0.825 would nullify this bullish view.
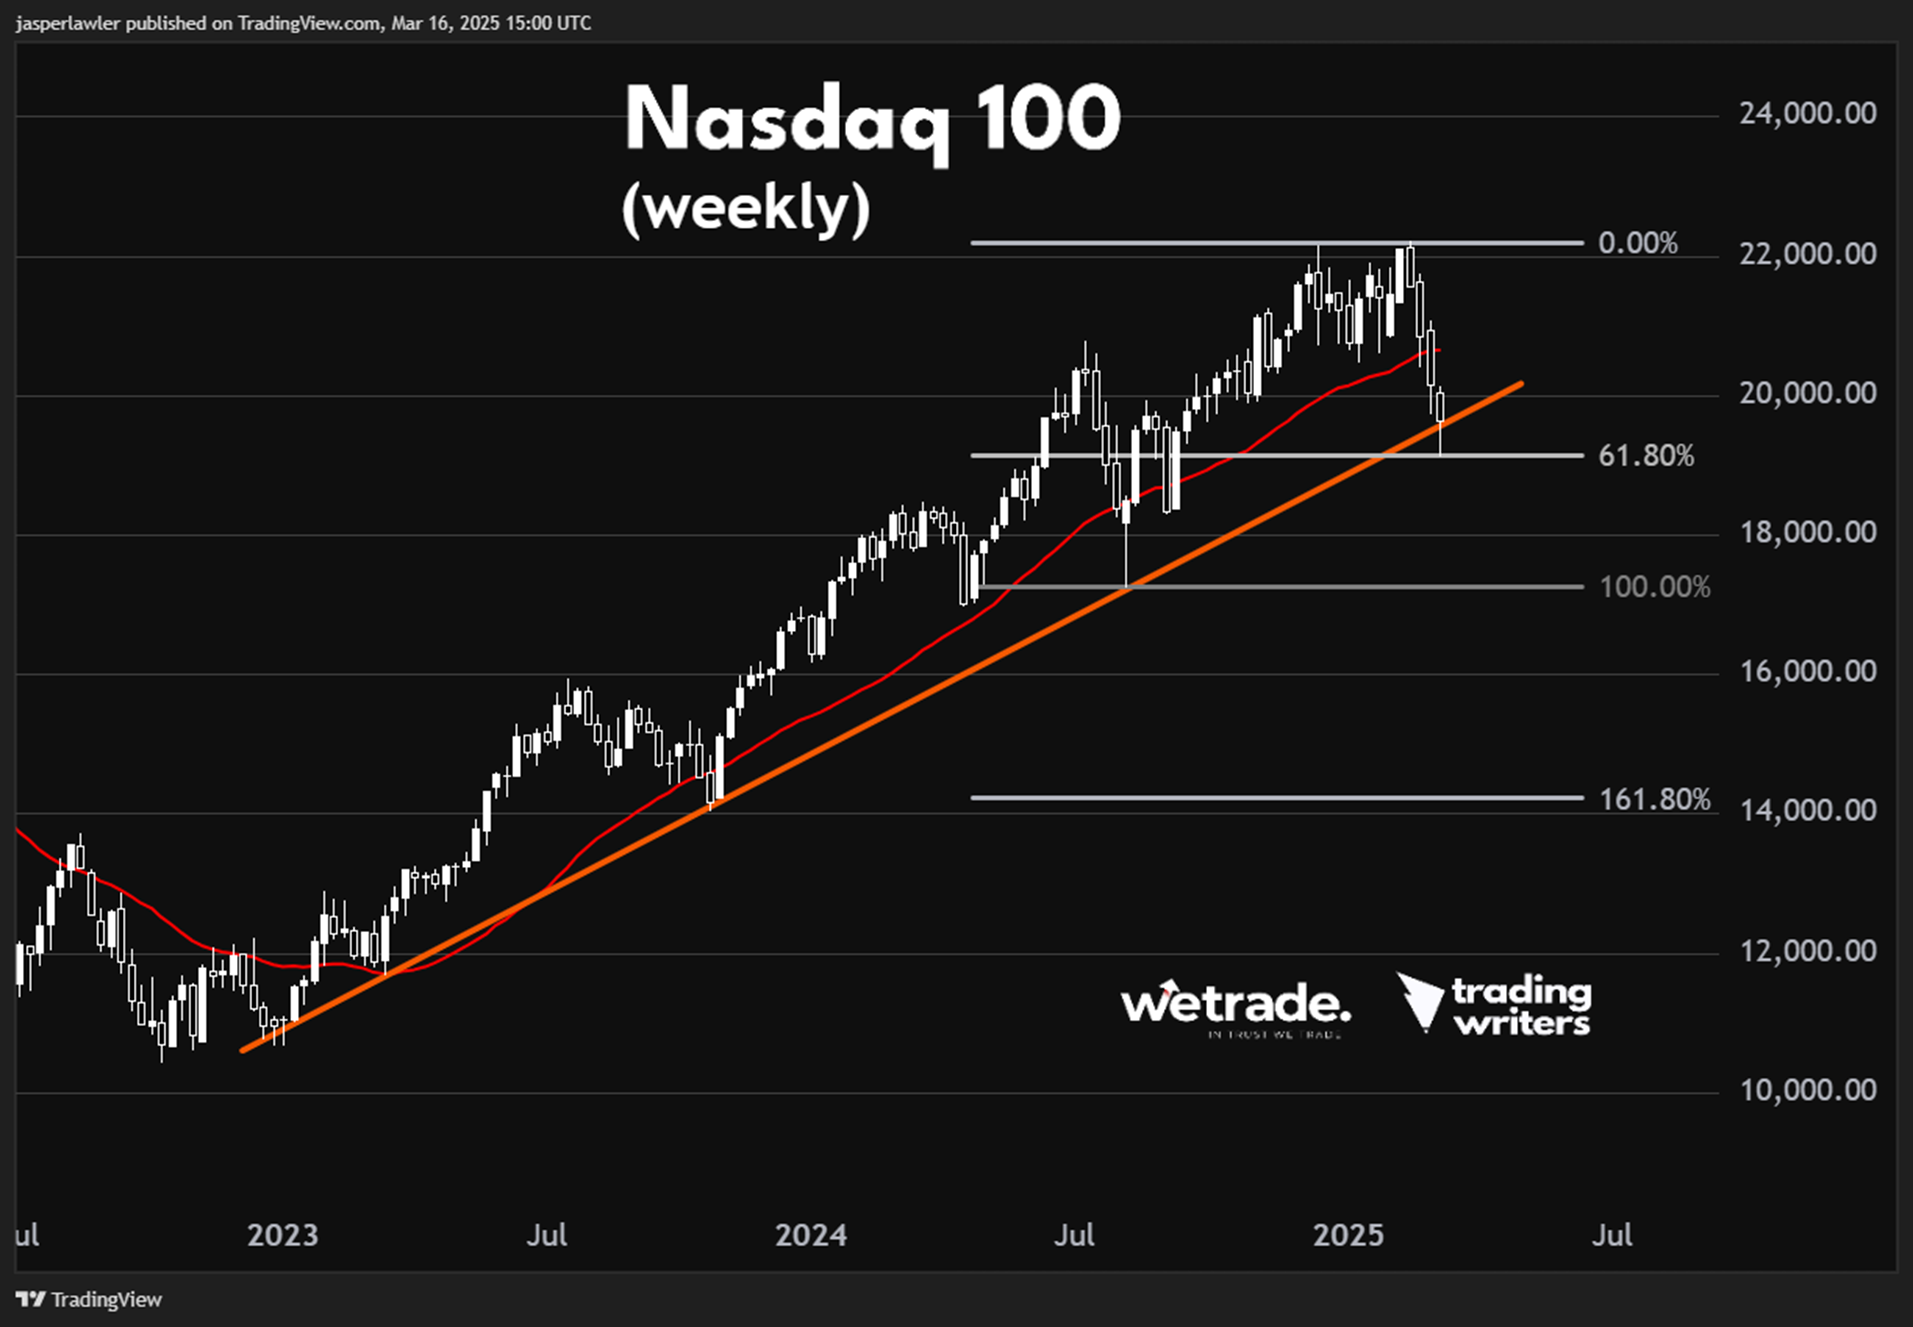
Nasdaq 100 (US Tech 100)
Long term chart (monthly).
Trend: Up.
Phase: Pullback.
Resistance = 22,000.
Support = 17,000
Price action: The price managed to close the week above its long term rising trendline after rebounding from the 61.8% Fibonacci retracement level, which is a bullish result.
View: Cautiously bullish. We will turn bearish with a weekly close under the rising trendline.
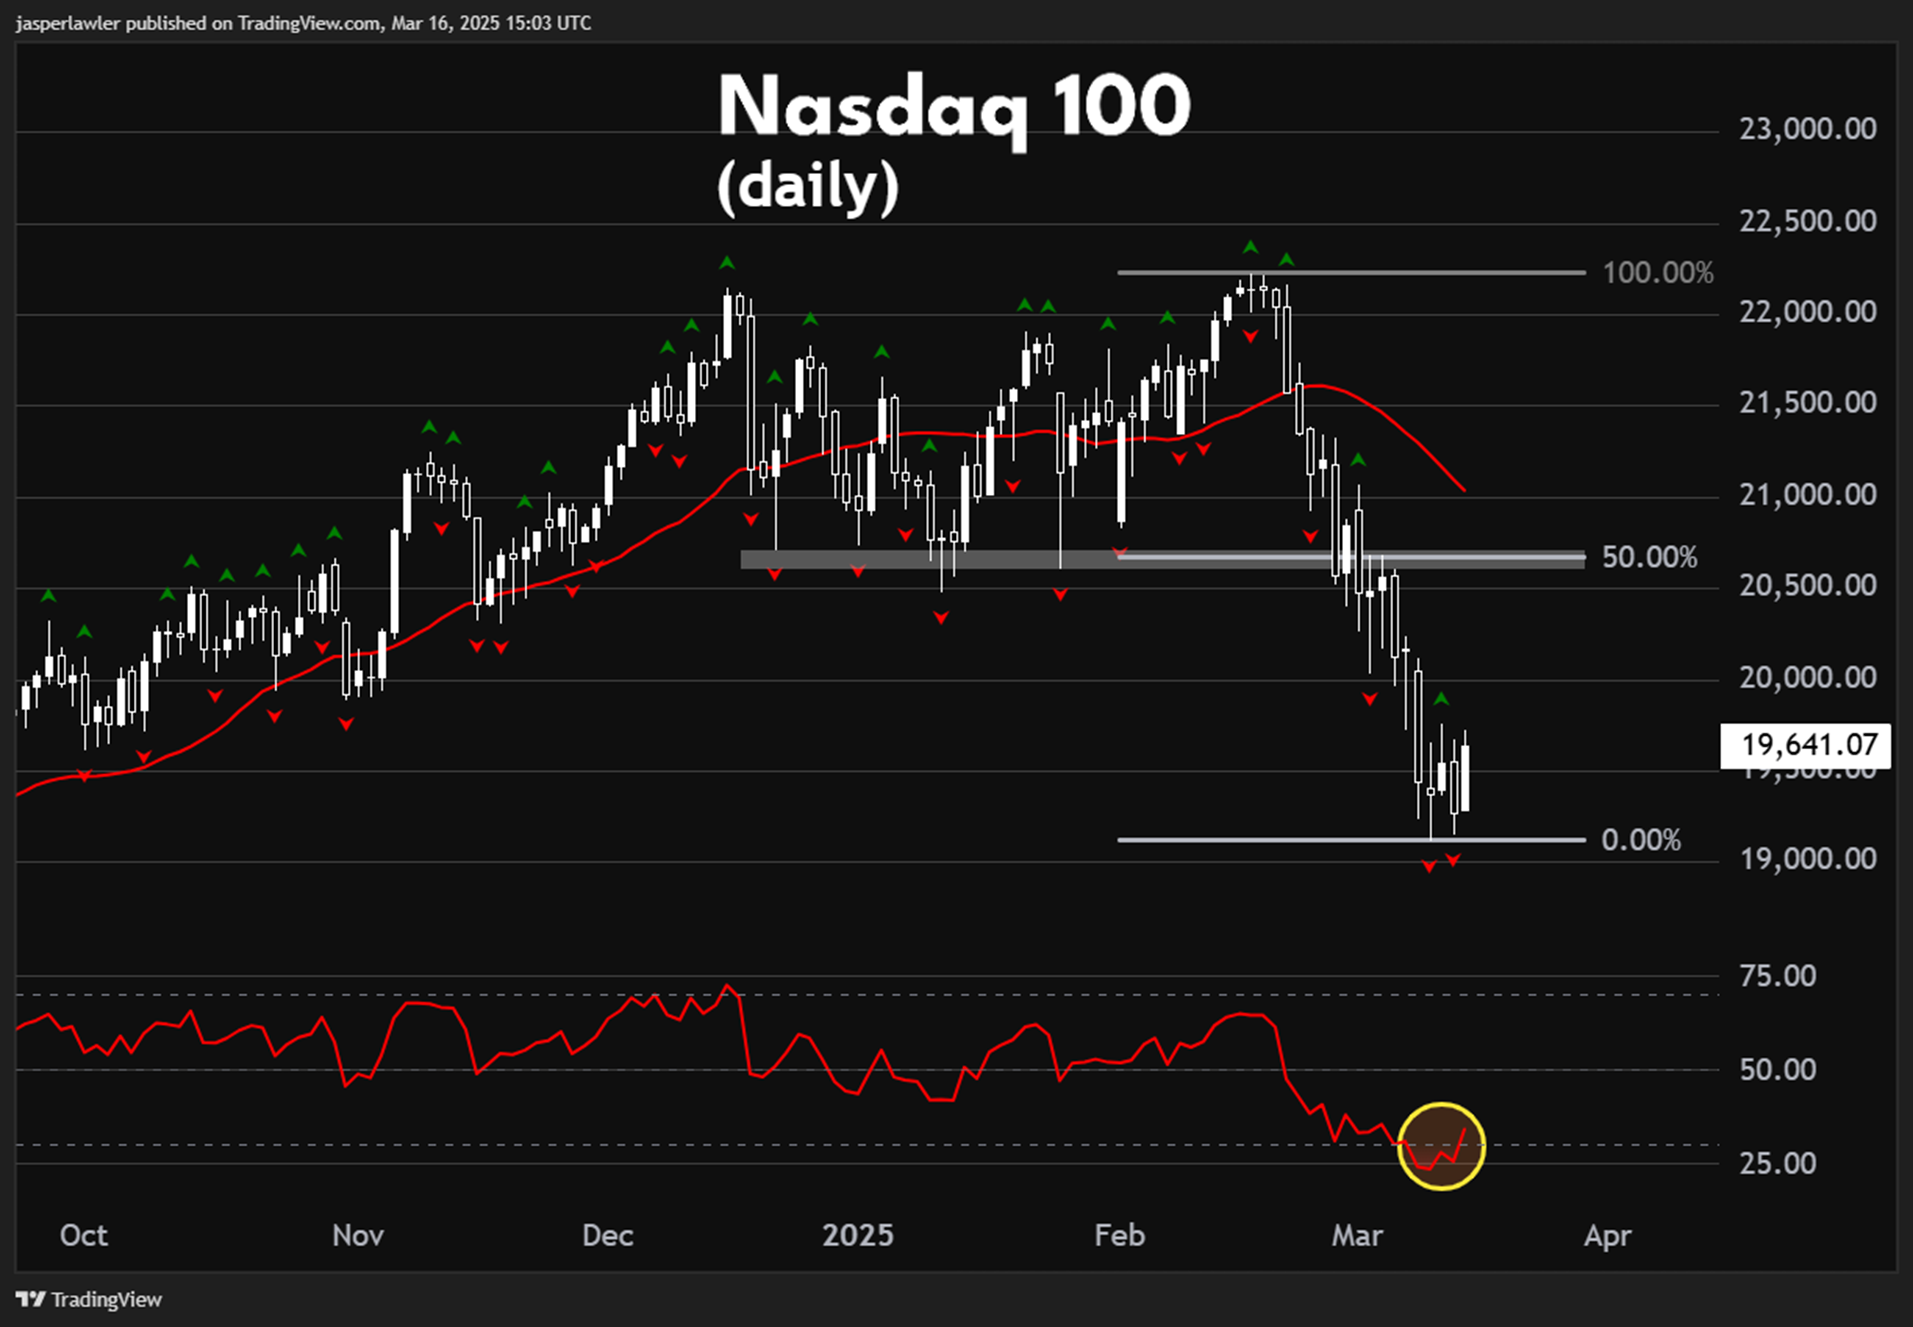
Medium term chart (daily)
Trend: Down.
Phase: Possible bounce coming.
Resistance = 20,500.
Support = 19,000.
Price action: An oversold RSI indicates at least an interim low has formed, in which case a 50% retracement of the latest decline would coincide with former support at 20,500. We’d be hesitant to get long against the trend without some kind of bottom pattern via rebound and retest of the lows (i.e. an ABC pattern).
In collaboration with WeTradeBroker
Author

Jasper Lawler
Trading Writers
With 18 years of trading experience, Jasper began his career as a stockbroker on Wall Street in New York City before sharpening his analytical skills at top trading firms in the City of London.


