FOMC Preview: A deceleration in rate hikes?
Tuesday was an interesting one for the financial markets, welcoming US consumer price inflation data for November (Consumer Prices Index [CPI]). Headline annual inflation slowed for a fifth consecutive month to 7.1%, following October’s reading of 7.7%, according to the Bureau of Labour Statistics. The report observed that November’s release was the smallest annual increase since December 2021. Core annual inflation, which excludes volatile components such as food and energy, also slowed to 6.0%, down from 6.3% in October. Additionally, month-over-month data saw November slow to 0.1% versus 0.4% in October and the core measure decelerate to 0.2% following October’s 0.3%.
Given the released numbers demonstrated an evident surprise miss in terms of the economists’ forecast range, the market’s immediate response should not shock. US index equity futures soared and the US dollar, along with US Treasury yields, took a hit. Procyclical currencies such as the Australian dollar, the New Zealand dollar and the Canadian dollar all benefitted on the day, rallying strongly against their US counterpart, with safe-haven currencies sharply falling.
Markets clearly welcomed the news, a release that not only highlights a potential peak in the headline inflation rate—9.1% in June—but it also reinforces the Fed’s case for a smaller rate increase tomorrow.
FOMC: 50bp Hike on the table
The FOMC meeting—the last one of the year—is scheduled to take place at 7 pm GMT today, followed by the FOMC press conference 30 minutes after. We will also receive the FOMC’s Summary of Economic Projections, which is released each quarter. This is where Fed members present their latest projections for the next two years, with attention largely directed to the so-called dot–plot: members’ assessment for the federal funds rate and its longer-run value. Many are expecting to see an increase in the terminal dot-plot figure to between 5.0% and 5.5%.
Strengthened by the latest inflation data, the majority of desks also believe a 50bp increase is likely which would cap a run of 4 consecutive 75bp hikes seen in the prior 4 meetings. A 50bp move would nudge the Federal Funds target range to 4.25%-4.50%. Interestingly, the target rate probabilities, according to the CME’s FedWatch Tool, shows an 80.0% probability for a 50bp hike over a 20% chance for a 75bp increase.
Should a deceleration to 50bps unfold, it will be interesting to see whether Fed Chair Jerome Powell hints at a possible 25bp hike for February’s meeting.
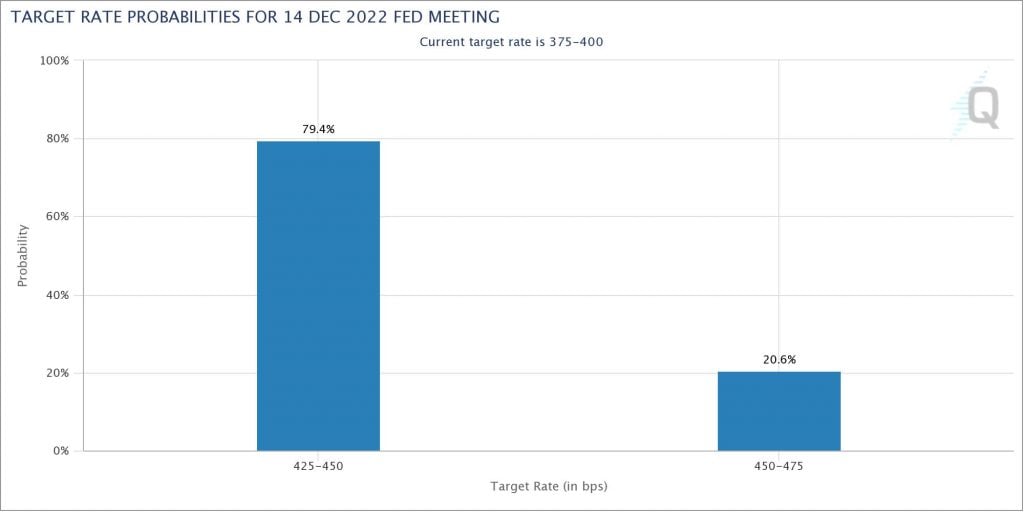
(CME Group FedWatch Tool)
Technical view for currencies ahead of the FOMC decision
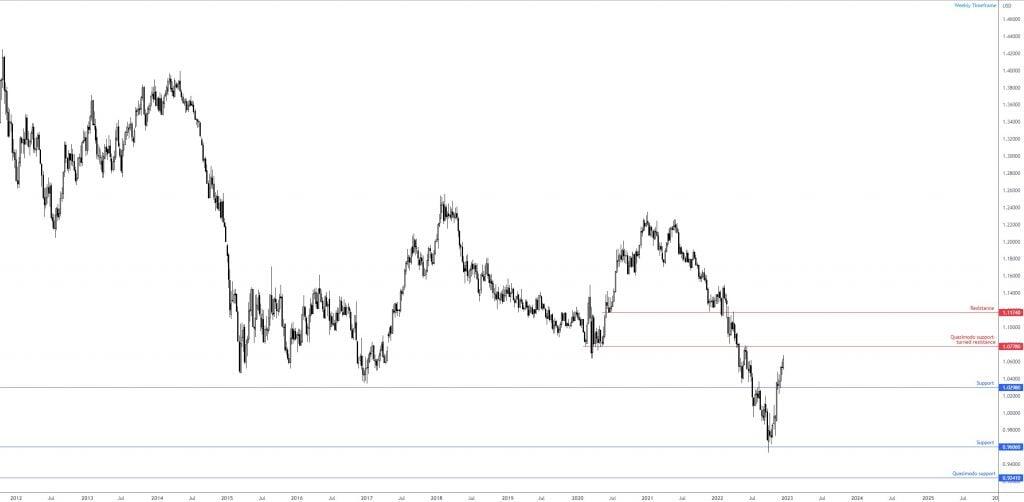
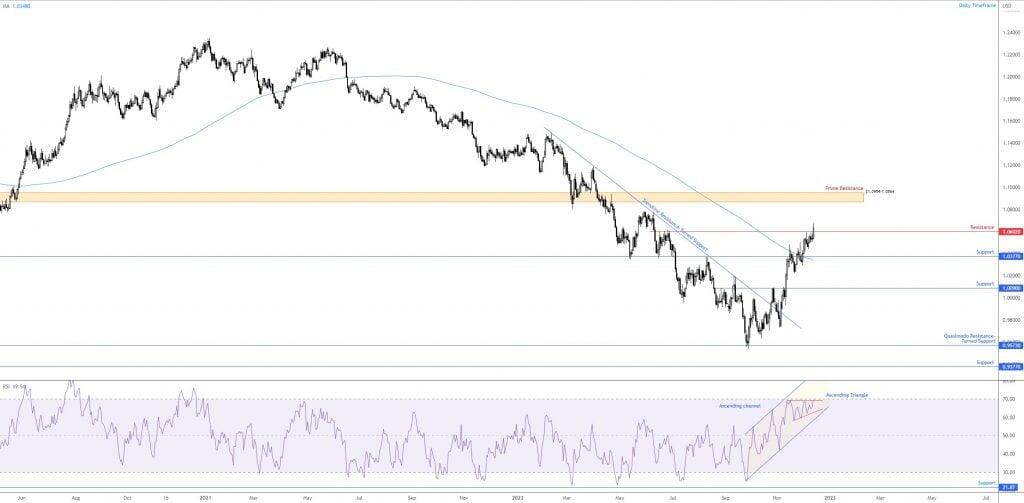
The US Dollar Index remains comfortable south of its 200-day simple moving average, currently fluctuating around 105.80. Overall, given the technical trend has been lower since topping in 114.78 (note the clear lower lows/highs), the outlook for the greenback remains bearish, targeting daily support around 102.36: a Quasimodo formation. It should not surprise, therefore, to see that the EUR/USD is poised to climb (two inversely correlated markets). Price movement on the weekly timeframe demonstrates scope to approach resistance at $1.0778, which implies daily price may attempt to cement position above resistance at $1.0602 (the US inflation print underpinned a EUR/USD bid which saw the currency pair voyage north of the level). This could prompt continuation buying towards the noted weekly resistance level, followed by prime resistance on the daily scale at $1.0954-1.0864. Also supporting a bullish offensive is the daily chart, showing signs of a trend reversal to the upside through a series of higher highs and lows since bottoming in late September at $0.9536 and the pair crossing above its 200-day simple moving average at $1.0348.
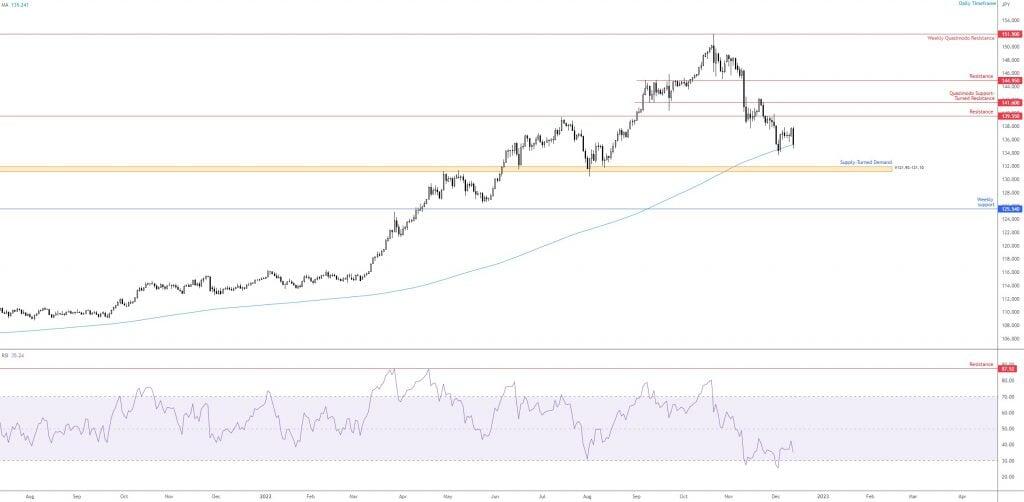
In light of the recent USD softness, the USD/JPY recently shook hands with the 200-day simple moving average at ¥135.24 after recoiling from the line in early December, and reaching a high of ¥137.86. Overhead calls attention to daily resistance at ¥139.55, while pursuing territory under the 200-day SMA unearths a daily supply-turned demand area at ¥131.93-131.10. Given the latest trend structure (shaped by way of a peak at ¥151.94 and subsequent lower highs/lows), a break to the downside should not raise too many eyebrows, with breakout sellers potentially pushing for the noted demand base. Nevertheless, do note that this is a market that has been notably trending higher since the beginning of 2021, therefore dip buyers could still be active.
Dollar Index daily chart

EUR/USD weekly and daily charts
USD/JPY daily chart
Author

Aaron Hill
FP Markets
After completing his Bachelor’s degree in English and Creative Writing in the UK, and subsequently spending a handful of years teaching English as a foreign language teacher around Asia, Aaron was introduced to financial trading,


