FOMC day
USD: Sept '24 is Down at 100.480.
Energies: Oct '24 Crude is Down at 69.10.
Financials: The Dec '24 30 Year T-Bond is Down 12 ticks and trading at 126.16.
Indices: The Sept '24 S&P 500 emini ES contract is 28 ticks Higher and trading at 5707.25.
Gold: The Dec'24 Gold contract is trading Up at 2601.80.
Initial conclusion
This is not a correlated market. The USD is Down and Crude is Down which is not normal, and the 30 Year T-Bond is trading Lower. The Financials should always correlate with the US dollar such that if the dollar is Higher, then the bonds should follow and vice-versa. The S&P is Higher and Crude is trading Lower which is correlated. Gold is trading Higher which is correlated with the US dollar trading Down. I tend to believe that Gold has an inverse relationship with the US Dollar as when the US Dollar is down, Gold tends to rise in value and vice-versa. Think of it as a seesaw, when one is up the other should be down. I point this out to you to make you aware that when we don't have a correlated market, it means something is wrong. As traders you need to be aware of this and proceed with your eyes wide open. Currently Asia is trading Mixed. All of Europe is trading Lower.
Possible challenges to traders
-
Building Permits is out at 8:30 AM EST. This is Major.
-
Housing Starts are out at 8:30 AM EST. This is Major.
-
Crude Oil Inventories is out at 10:30 AM EST. This is Major.
-
Federal Funds Rate is out at 2 PM EST. This is Major.
-
FOMC Economic Projections is out at 2 PM EST. This is Major.
-
FOMC Statement is out at 2 PM EST. This is Major.
-
FOMC Press Conference starts at 2:30 PM EST. This is Major.
-
TIC Long Term Purchases is out at 4 PM EST. This is not Major.
Traders, please note that we've changed the Bond instrument from the 10 year (ZN) to the 2 year (ZT). They work exactly the same.
We've elected to switch gears a bit and show correlation between the 2-year Treasury notes (ZT) and the S&P futures contract. The YM contract is the Dow Jones Industrial Average, and the purpose is to show reverse correlation between the two instruments. Remember it's likened to a seesaw, when up goes up the other should go down and vice versa.
Yesterday the ZT migrated Lower at around 8 AM EST with no real economic news released and began its Downward slide. Look at the charts below and you'll see a pattern for both assets. The Dow moved Higher at 8 AM and the ZT moved Lower at around the same time. These charts represent the newest version of Bar Charts, and I've changed the timeframe to a 15-minute chart to display better. This represented a Short opportunity on the 2-year note, as a trader you could have netted about 30 ticks per contract on this trade. Each tick is worth $7.625. Please note: the front month for ZT is Dec and the Dow is still Sept '24. I've changed the format to filled Candlesticks (not hollow) such that it may be more apparent and visible.
Charts courtesy of Barcharts
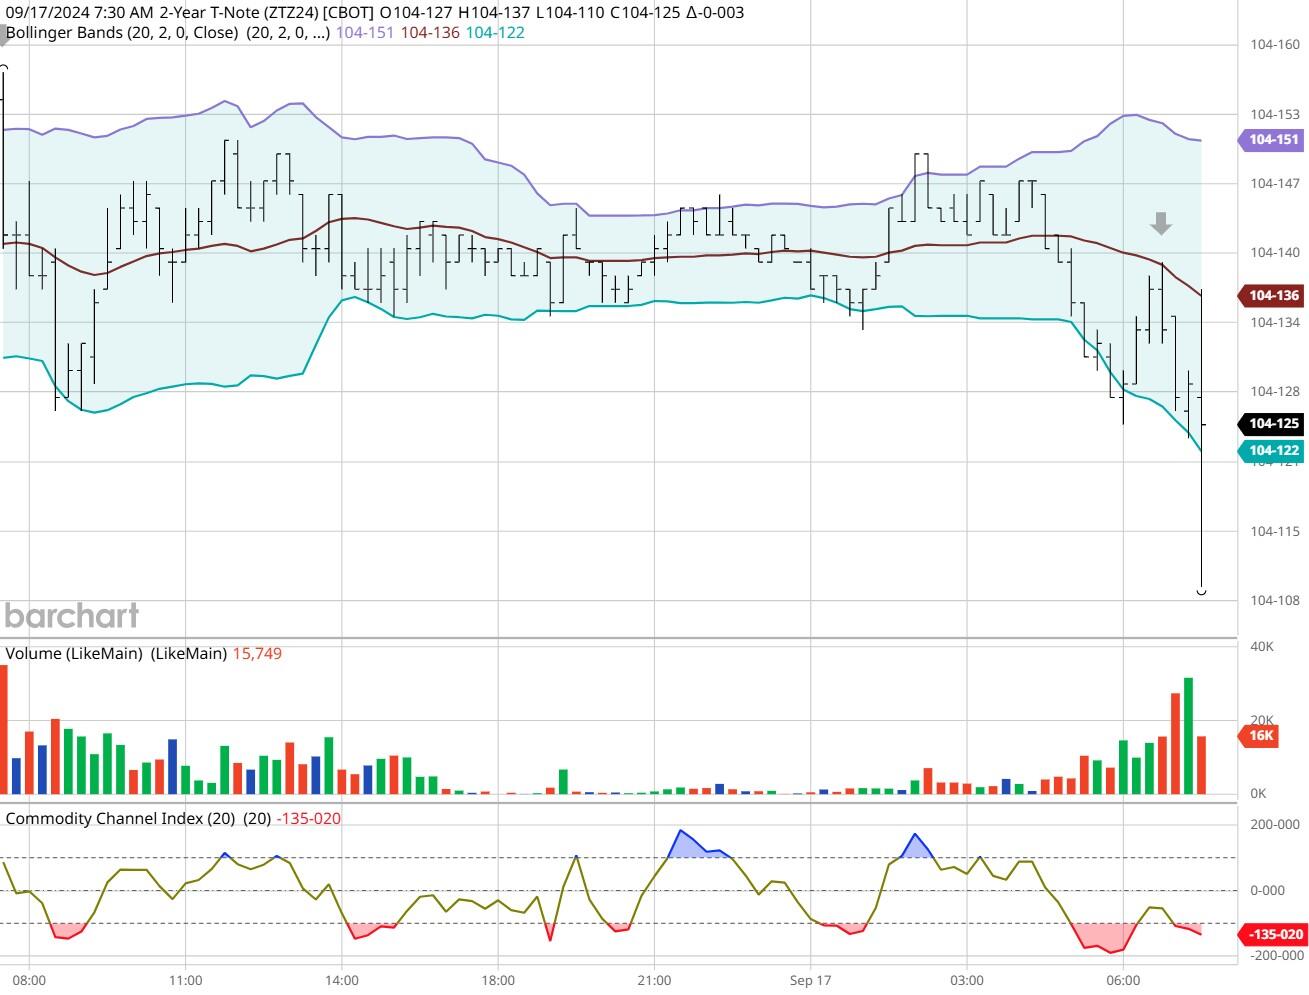
ZT -Dec 2024 - 09/17/24
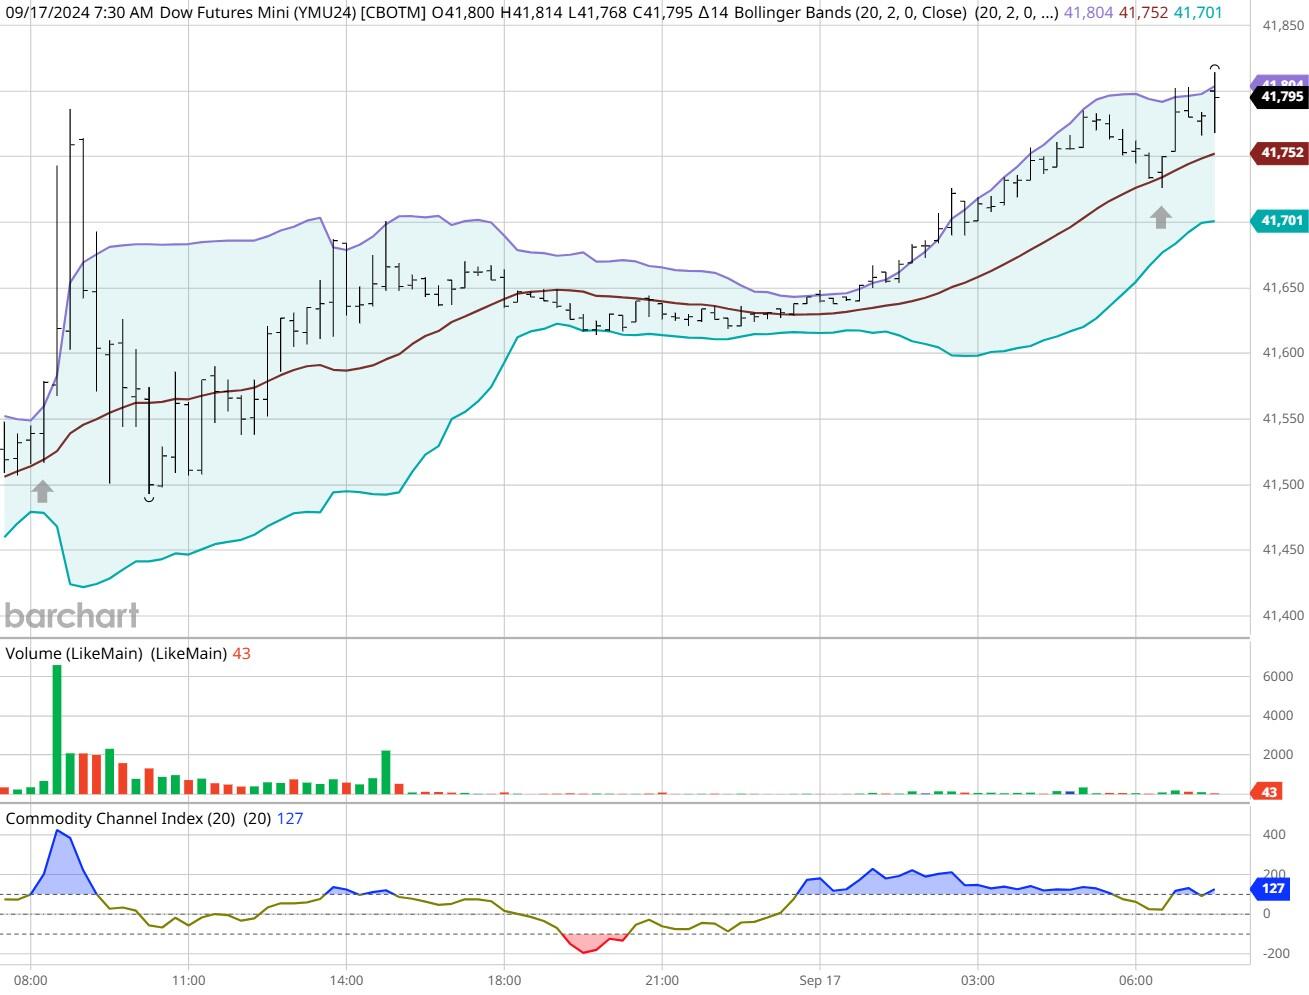
Dow - Sept 2024- 09/17/24
Bias
Yesterday we gave the markets an Upside bias as the USD and Gold were both down Tuesday morning and that usually represents an Upside Day. The Dow did trade Higher most of the session up until about 3 PM EST and ending the session down 16 points. The S&P and Nasdaq both closed Higher. Given that today is FOMC Day our bias is Neutral or Mixed.
Could this change? Of Course. Remember anything can happen in a volatile market.
Commentary
Yesterday we had about 7 economic reports, but they didn't really impact the markets in a major way. That won't be true of today's session as the long-awaited interest rate cuts are baked into the markets. What isn't known is whether or not the cut will be a quarter or half a point. My concern is what if? What if the Fed doesn't cut rates at all as it's too close to the Presidential election and perhaps the Fed doesn't want to appear too biased. After all they don't know who their boss will be come January and yes, I know the Fed doesn't really have a "boss" perse but whoever the president is come 2025 they could ask them to stay on or not. This is why we always maintain a Neutral bias on FOMC Day as the markets have never shown any sense of normalcy on this day.
Author

Nick Mastrandrea
Market Tea Leaves


