![]() Richard Perry
Richard Perry
Independent Analyst
Market Overview
As US traders return from Independence Day public holiday, attention will now turn to some key tier one economic data in the coming days that will drive the market sentiment. Today we have the announcement of the FOMC minutes from the June meeting. An assertion that the recent inflation weakness is only transitory and will pick up again as the year progresses will increase expectation of a third 2017 hike in December. This would pull yields higher, strengthen the dollar and be likely to drag on equities. As trading warms up this morning, Treasury yields have ticked marginally lower and this is putting a little negative pressure on the dollar today. This is seen across forex majors but also in a slight rally on gold and silver. Geopolitics in the Middle East are also an issue with the countries such as Saudi Arabia, Egypt and the UAE meeting to discuss whether to continue with the sanctions imposed on Qatar over its alleged links to terrorism. This has the potential to be supportive for safe havens.

Wall Street was closed yesterday for Independence Day so there was little steer for markets. Asian markets were mildly higher overnight (Nikkei +0.2%) whilst European markets are reacting with caution and are trading slightly lower. In forex, there is a mild rebound on majors against the dollar, with the Aussie being the biggest beneficiary of this after yesterday’s sharp losses. In commodity markets, gold and silver are taking advantage of the mild dollar weakness to look to form support, whilst the rally on the oil price is stalling a touch today.
Services PMIs and the Fed minutes are in focus for traders today. The Eurozone PMIs are out through the early morning and the focus will be on whether the Eurozone Composite PMI at 0900BST will drop to 55.7 (from 56.8 last month). The UK Services PMI at 0930BST is important as it accounts for around 80% of the UK economy and is expected to drop slightly to 53.5 (from 53.8 last month). Following in the wake of disappointing manufacturing and construction PMIs for the UK, a disappointing services PMI would certainly put pressure on sterling. US Factory Orders are at 1500BST and are expected to fall by -0.5% for the month (after falling by -0.2% last month). However the big focus will be on the FOMC minutes for the mid-June meeting. The Fed fleshed out its balance sheet reduction in the meeting, but inflation will be key for the minutes. Inflation in the US has disappointed recently and Fed expectations of how inflation will develop in the coming months will be key for expectations of a December rate hike which is becoming an increasing probability according to Fed Funds futures.
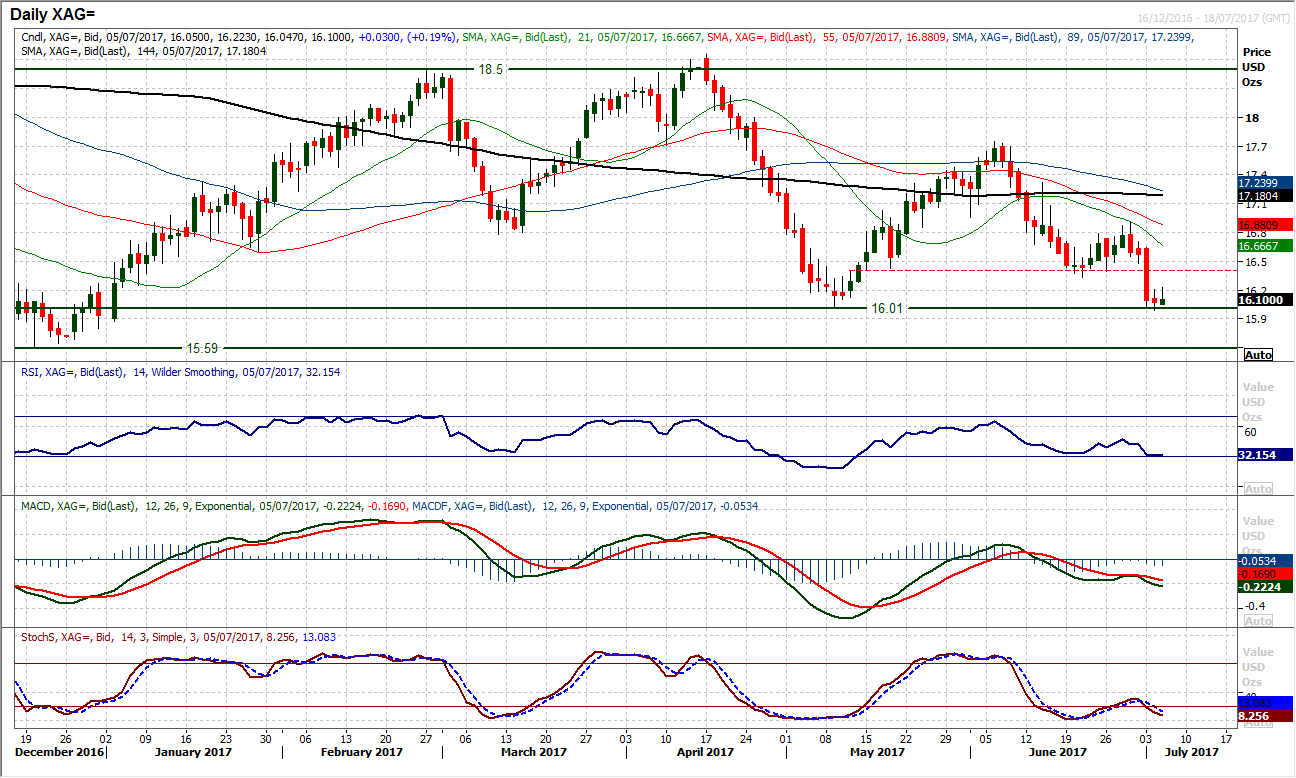
Chart of the Day – Silver
The precious metals have had a tough time recently. Primarily as the dollar strengthened on Monday, a sharp bear candle formation on silver is now directly threatening the support of the key May low at $16.01. This suggests that silver stands on the brink of a significant breakdown. The momentum indicators are bearishly configured but also the RSI is around 30. This has often limited downside, but during the big May sell-off the RSI got to 18 during a huge run of sequenced bear candles. When momentum turns bearish it can really go for silver. That would suggest the support is crucial at $16.01 which has held firm for two completed sessions now and continues to hold today. A downside break would be the lowest price on silver since December and open $15.59 which is the floor of arguably a nine month range. The MACD lines have just bear kissed and the Stochastics have turned lower, all of which does not bode well for the support. The concern would be that rallies would also be seen as a chance to sell, with a band of overhead supply between $16.33/$16.90. The hourly chart shows momentum is bearishly configured across the time scales and a closing breakdown of $16.01 could open the floodgates once more.
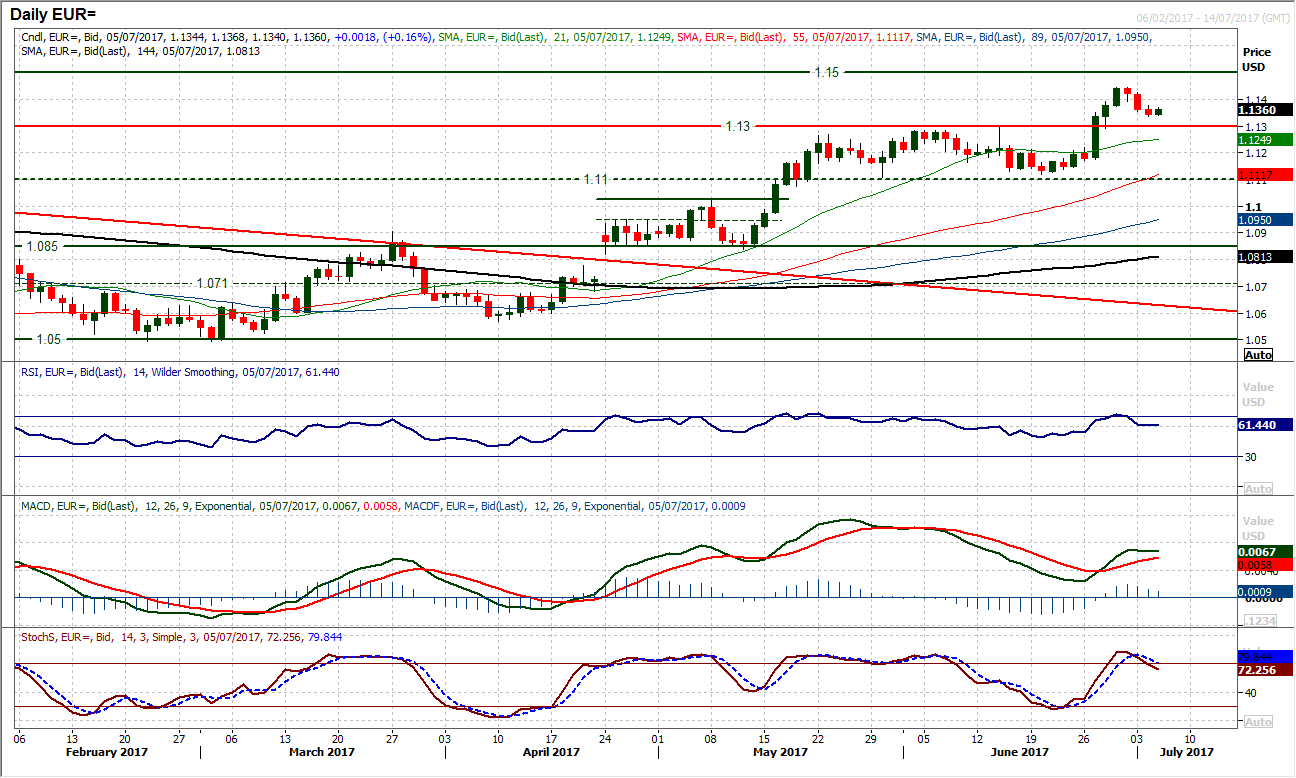
EUR/USD
The corrective move on the euro has completed three negative sessions now but the expectation remains that this correction is another chance to buy. The breakout support of the old range highs $1.1285/$1.1295 are a source of near term demand where old resistance becomes new support. The momentum indicators are also still broadly positively configured with the RSI unwinding back towards 60 and the MACD lines still favourable. The only caveat is the crossing lower on the Stochastics, however this looks still to be a rather benign move in light of other positive momentum set up. Initial support around $1.1335 held throughout yesterday but it will be interesting to see how traders pick up again today after the US public holiday. The upside target from the breakout of the range above $1.1300 implies $1.1500 and this remains the target if the recent drop can build good support again.
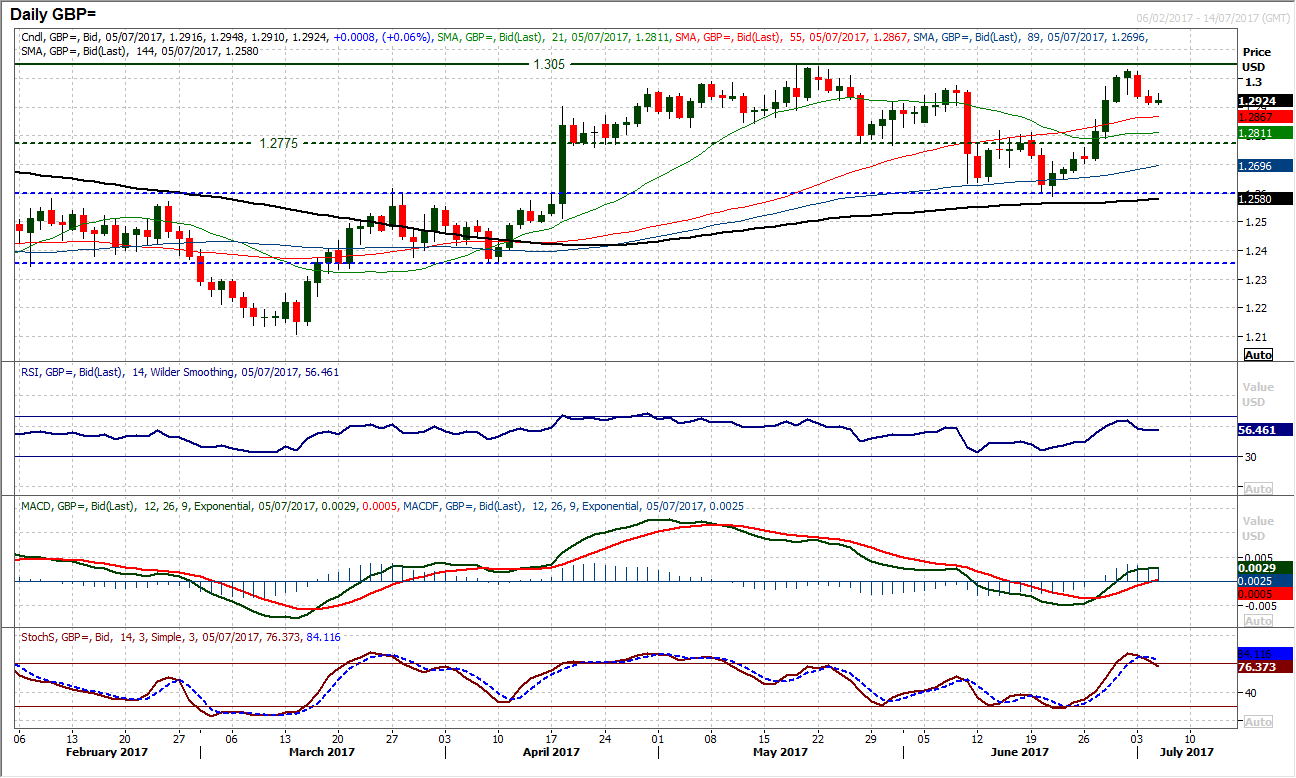
GBP/USD
It was a far milder negative session yesterday, however the move was still lower as the brief correction has taken hold. This correction back from $1.3030 was under the $1.3047 key May high and suggests that a medium term range is now in formation between $1.2600/$1.3050. With the recent rally falling over there is a potential now for another retracement back towards the pivot at $1.2775. Momentum indicators are somewhat ranging now on a medium term basis and are rolling over to give the daily chart a near term corrective outlook. However the selling pressure does not appear to be too excessive and for now this seems to be a fairly orderly correction. The hourly chart reflects this outlook and with a drop below $1.2945 there is a near term corrective target of $1.2860. There is an initial resistance band $1.2945/$1.2960.
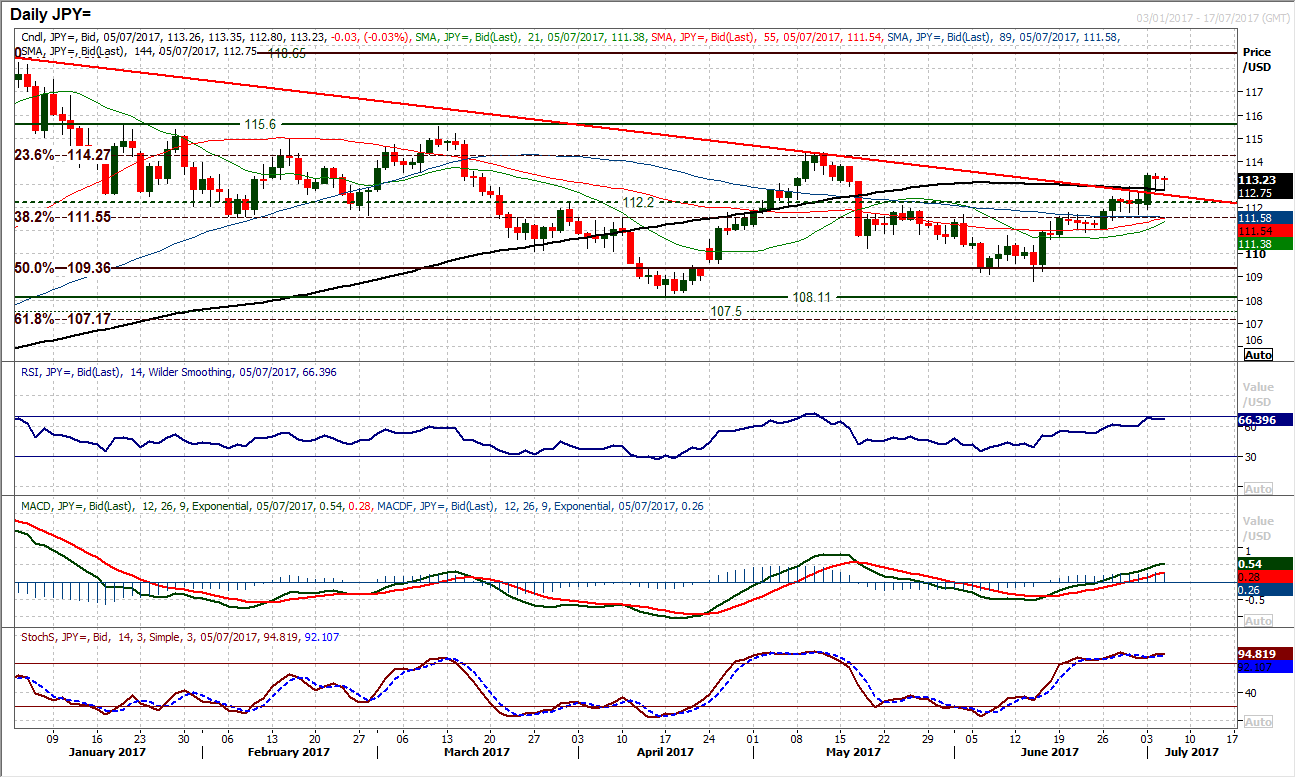
USD/JPY
With the decisive breakout that came with Monday’s strong bull candle, corrections are now a chance to buy. This has been a theme of recent weeks where consolidation moves resolve in a key upside break. The market is now trading well clear of the old pivot band 111.60/112.20 and above the 38.2% Fibonacci retracement at 111.55 which has opened the key May high at 114.35. Yesterday’s candle showed that even though there was a safe haven demand, the bulls were still present enough to support the dip. Momentum indicators remain strong with the MACD lines rising strongly, the RSI in the mid-60s and Stochastics bullishly configured. Buy into intraday weakness. Since the rally took hold in mid-June, any intraday corrections have been bought into (look at the long lower shadows on several of the candles). The hourly chart shows the support band 112.45/112.90 is holding firm and this latest unwinding move is ready for the bulls to resume control.
Gold
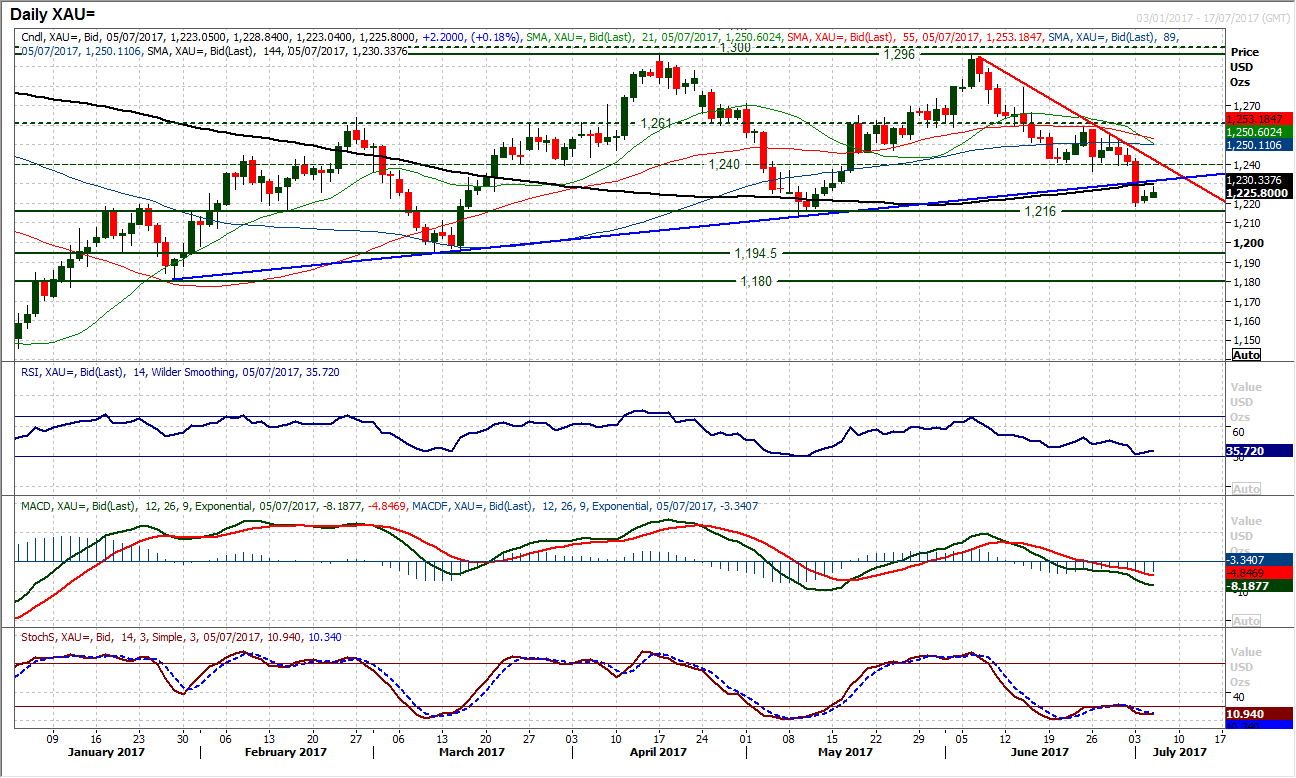
The sharp bearish downside break candle from Monday still dominates the near term outlook with the lack of real intent in the buying pressure. The downtrend of the past few weeks comes in as resistance today at $1242 so there is room for an unwinding move but the negative momentum suggests that the bulls will struggle to gain traction. There is though a degree of room for a technical rally as there is little significant resistance until back towards $1236.50/$1240. However the underside of the old uptrend is a barrier around $1231 added to by the 144 day moving average at $1230. The hourly chart shows a markets simply unwinding near term oversold momentum which is helping to renew downside potential. Initial resistance is at the overnight high of $1228.80. There is minor support from yesterday’s low around $1220 but expect further pressure on $1218.30 and to test the key May low at $1213.80. Subsequent key lows are $1194.50 and $1180.
WTI Oil
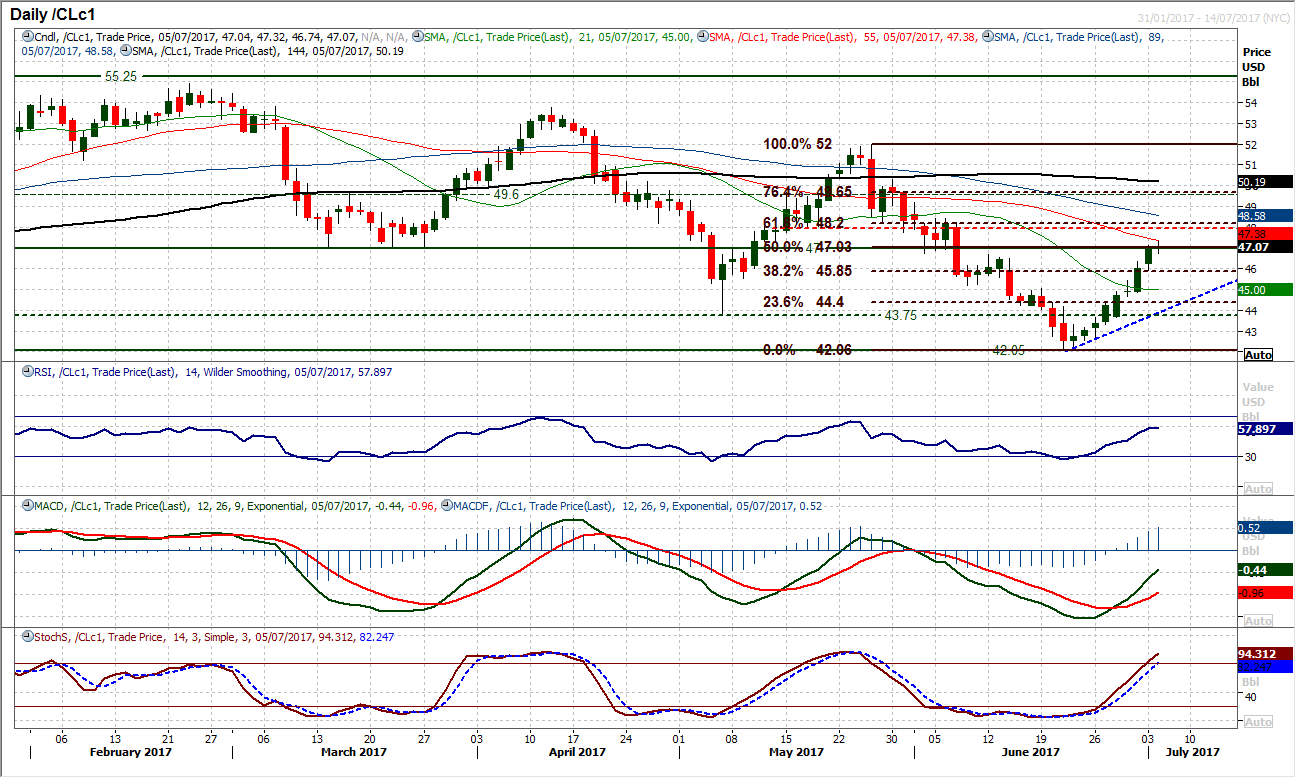
With the US shut for Independence Day holiday, volume has been very light and the market consolidated. This comes around the key resistance around $47.00 which is an old pivot. Momentum remains strong in the rally and a breach of this resistance would be another strong indication for oil to continue the rebound. A successful breach of $47.00 opens the next resistance which is a band between $48.00/$48.20. The hourly chart shows little sign of a slowdown in the move, with corrections being bought into. There is an initial support band $45.90/$46.45 whilst the uptrend of the past week currently supports around $47.00.
Dow Jones Industrial Average
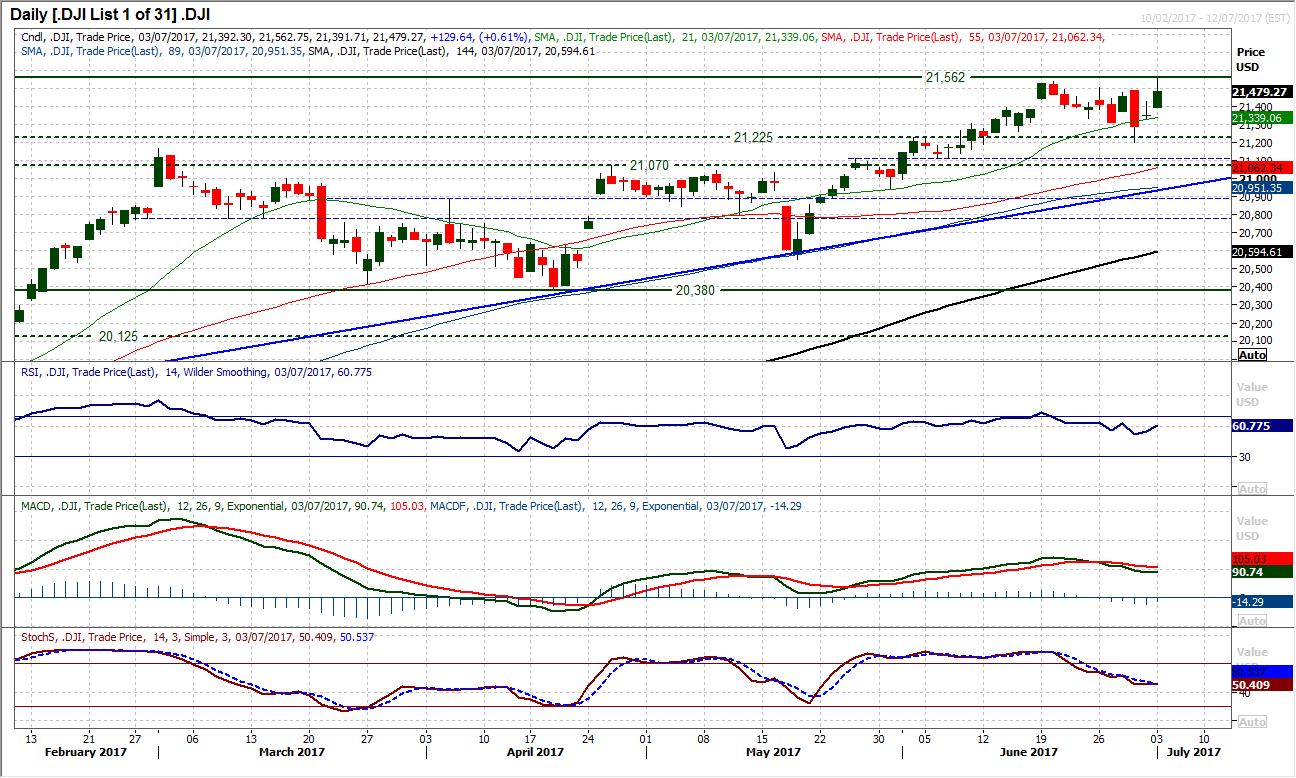
The bulls bounced back again on Monday, although it was interesting to see that the Dow (just 30 stocks) rallied much harder than the far broader S&P 500 (500 stocks), suggesting perhaps a less decisive move than first seems. The move on the Dow to another new all-time high, hitting 21,562 before coming off, could now sustain the move into the close, however maintains what looks to be a range play formation of the last few weeks. There is a range now between 21,197/21,562. The momentum indicators are positively configured but also reflect this recent range. This is also shown on the hourly chart which has just rolled over again on momentum as the market dropped back slightly into the close.
Wall Street was shut yesterday for Independence Day public holiday.
Note: All information on this page is subject to change. The use of this website constitutes acceptance of our user agreement. Please read our privacy policy and legal disclaimer. Opinions expressed at FXstreet.com are those of the individual authors and do not necessarily represent the opinion of FXstreet.com or its management. Risk Disclosure: Trading foreign exchange on margin carries a high level of risk, and may not be suitable for all investors. The high degree of leverage can work against you as well as for you. Before deciding to invest in foreign exchange you should carefully consider your investment objectives, level of experience, and risk appetite. The possibility exists that you could sustain a loss of some or all of your initial investment and therefore you should not invest money that you cannot afford to lose. You should be aware of all the risks associated with foreign exchange trading, and seek advice from an independent financial advisor if you have any doubts.
Recommended Content
Editors’ Picks
EUR/USD eases below 1.0900 amid cautious mood

EUR/USD has erased gains to trade on the back foot below 1.0900 early Tuesday. The pair treads water amid a cautious market mood, as traders weigh the US political updates and China slowdown worries. The US Dollar remains subdued, in the absence of top-tier economic data.
GBP/USD drops toward 1.2900 as US Dollar looks to stabilize

GBP/USD is dropping toward 1.2900, lacking firm direction in European trading on Tuesday. The US Dollar looks to stabilize after the early decline, weighing on the pair. Traders await mid-tier US housing data for fresh trading impetus.
Gold's struggle with $2,400 extends amid market caution

Gold price is making another attempt to reclaim $2,400 on a sustained basis, replicating the moves seen during Monday’s Asian trading. Gold price appears to be benefiting from a typical market caution and renewed China’s economic worries and ahead of key US earnings reports.
Bitcoin finds support around the $67,000 level

Bitcoin and Ripple prices are holding steady around their respective weekly and daily support levels, hinting at an imminent rally. Meanwhile, Ethereum is encountering resistance at the $3,530 mark; a decisive close above this level would signal a bullish breakthrough.
Earnings review

While Nvidia’s results are still extremely important for overall sentiment, there is a hope that sales growth and revenues can pick up across a broad range of global markets and sectors.