Finally, an up day
USD: Mar '25 is Down at 106.905.
Energies: Apr '25 Crude is Up at 69.83.
Financials: The Mar '25 30 Year T-Bond is Lower by 9 ticks and trading at 117.26.
Indices: The Mar '25 S&P 500 emini ES contract is 88 ticks Higher and trading at 5985.25.
Gold: The Feb'25 Gold contract is trading Up at 2883.60.
Initial conclusion
This is a nearly correlated market. The USD is Down and Crude is Up which is normal, and the 30 Year T-Bond is trading Lower. The Financials should always correlate with the US dollar such that if the dollar is Higher, then the bonds should follow and vice-versa. The S&P is Higher and Crude is trading Higher which is not correlated. Gold is trading Higher which is correlated with the US dollar trading Down. I tend to believe that Gold has an inverse relationship with the US Dollar as when the US Dollar is down, Gold tends to rise in value and vice-versa. Think of it as a seesaw, when one is up the other should be down. I point this out to you to make you aware that when we don't have a correlated market, it means something is wrong. As traders you need to be aware of this and proceed with your eyes wide open. All of Asia traded Lower. All of Europe is trading Higher.
Possible challenges to traders
-
Final Manufacturing PMI is out at 9:45 AM EST. This is Major.
-
ISM Manufacturing PMI is out at 10 AM EST. This is Major.
-
ISM Manufacturing Prices is out at 10 AM EST. This is Major.
-
Construction Spending is out at 10 EST. This is Major.
-
Wards Total Vehicle Sales is out All Day by Brand. This is Major.
Traders, please note that we've changed the Bond instrument from the 10 year (ZN) to the 2 year (ZT). They work exactly the same.
We've elected to switch gears a bit and show correlation between the 2-year Treasury notes (ZT) and the S&P futures contract. The YM contract is the Dow Jones Industrial Average, and the purpose is to show reverse correlation between the two instruments. Remember it's likened to a seesaw, when up goes up the other should go down and vice versa.
On Friday the ZT Migrated Higher at around 8:30 AM EST as the 8:30 AM news was reported. The Dow moved Lower at the same time. Look at the charts below and you'll see a pattern for both assets. The Dow moved Lower at 8 AM EST and the ZT moved Higher at around the same time. These charts represent the newest version of Bar Charts, and I've changed the timeframe to a 15-minute chart to display better. This represented a Long opportunity on the 2-year note, as a trader you could have netted about 20 plus ticks per contract on this trade. Each tick is worth $7.625. Please note: the front month for ZT is now Jun '25 and the Dow is still Mar '25. I've changed the format to filled Candlesticks (not hollow) such that it may be more apparent and visible.
Charts courtesy of BarCharts
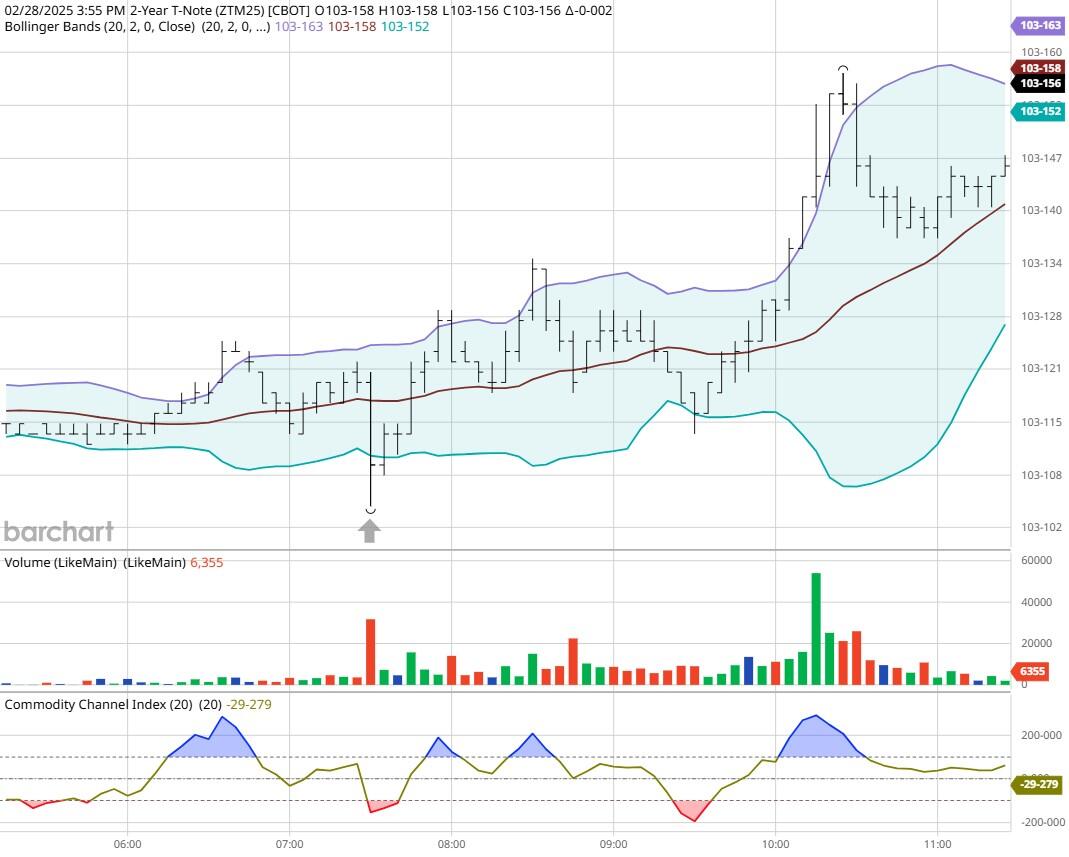
ZT -Jun 2025 - 2/28/25
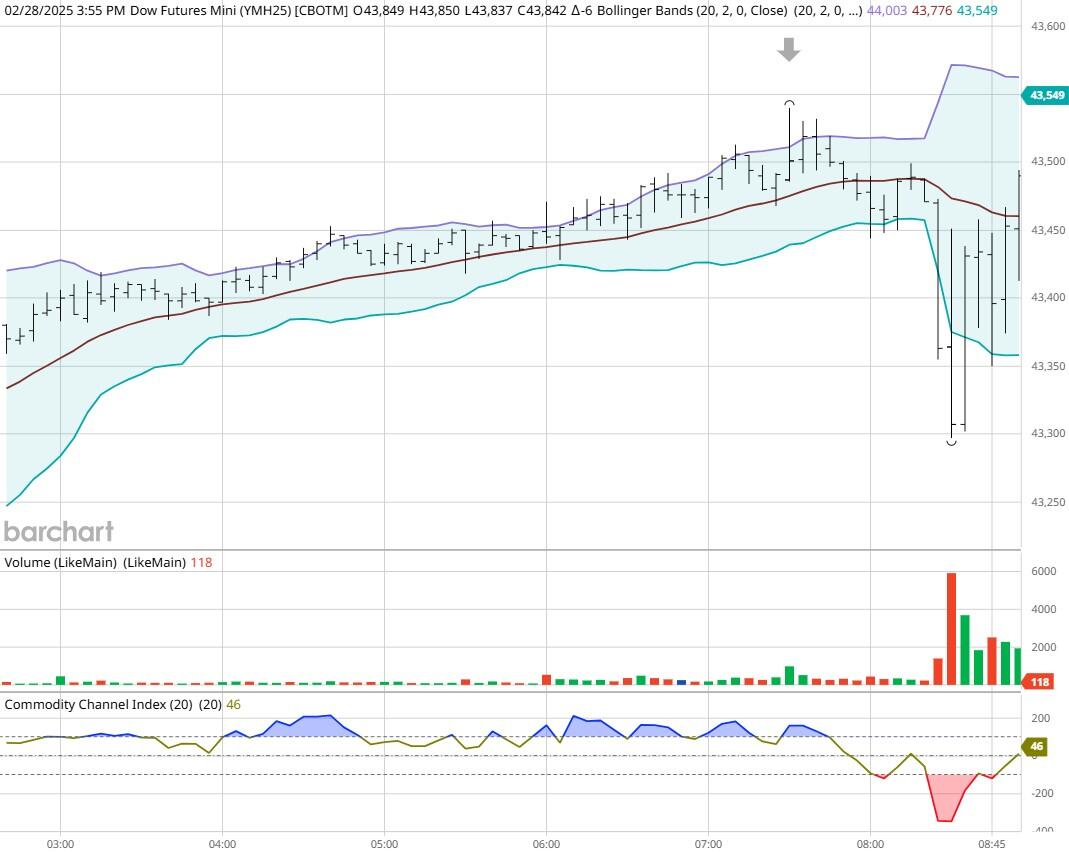
Dow - Mar 2025- 2/28/25
Bias
On Friday we gave the markets a Neutral or Mixed bias but ironically on our morning video we claimed that the markets could migrate Higher, and it did despite what happened between Trump and Zellensky. The Dow zoomed 601 points Higher, and the other indices roared Higher as well. Today we are dealing with a nearly correlated market and bias is to the Upside.
Could this change? Of Course. Remember anything can happen in a volatile market.
Commentary
So Friday came and went and the proverbial meeting between Zellensky and Trump and company didn't go very well. Trump and the VP claimed that Zellensky showed no thanks for all the help the US has given Ukraine and when he attempted to defend himself, they shot him down. Ironically the leaders in Europe gave a far better reception as they know Putin can't be trusted. Want to learn Market Correlation and determine market direction hours before the Opening Bell?
Author

Nick Mastrandrea
Market Tea Leaves


