Finally, a correlated market

USD: Jun '24 is Down at 104.660.
Energies: Jun '24 Crude is Up at 78.14.
Financials: The June '24 30 Year T-Bond is Up 6 ticks and trading at 117.15.
Indices: The Jun '24 S&P 500 emini ES contract is 126 ticks Higher and trading at 5359.50.
Gold: The Jun'24 Gold contract is trading Down at 2368.30
Initial conclusion
This is not a correlated market. The USD is Down and Crude is Up which is normal, but the 30 Year T-Bond is trading Higher. The Financials should always correlate with the US dollar such that if the dollar is Higher, then the bonds should follow and vice-versa. The S&P is Higher and Crude is trading Higher which is not correlated. Gold is trading Lower which is not correlated with the US dollar trading Down. I tend to believe that Gold has an inverse relationship with the US Dollar as when the US Dollar is down, Gold tends to rise in value and vice-versa. Think of it as a seesaw, when one is up the other should be down. I point this out to you to make you aware that when we don't have a correlated market, it means something is wrong. As traders you need to be aware of this and proceed with your eyes wide open. Asia is trading Higher with the exception of the Shanghai and Hang Seng exchanges which are Lower. Europe is trading mainly Higher with the exception of the London and Spanish Ibex which are Lower.
Possible challenges to traders
-
Unemployment Claims is out at 8:30 AM EST. This is Major.
-
Flash Manufacturing PMI is out at 9:45 AM EST. This is Major.
-
Flash Services PMI is out at 9:45 AM EST. This is Major.
-
New Home Sales is out at 10 AM EST. This is Major.
-
Natural Gas Storage is out at 10:30 AM EST. This is Major.
-
FOMC Member Bostic Speaks at 3 PM EST. This is Major.
Treasuries
Traders, please note that we've changed the Bond instrument from the 2 year (ZT) to the 10 year (ZN). They work exactly the same.
We've elected to switch gears a bit and show correlation between the 10-year Treasury notes (ZN) and the S&P futures contract. The S&P contract is the Standard and Poor's, and the purpose is to show reverse correlation between the two instruments. Remember it's likened to a seesaw, when up goes up the other should go down and vice versa.
Yesterday the ZN migrated Higher at around 8 AM EST as the S&P hit a High at around that time and the ZN migrated Higher. If you look at the charts below the ZN gave a signal at around 8 AM and started its Upward climb. Look at the charts below and you'll see a pattern for both assets. S&P moved Lower at around 8 AM and the ZN moving Higher at around the same time. These charts represent the newest version of MultiCharts and I've changed the timeframe to a 15-minute chart to display better. This represented a Long opportunity on the 10-year note, as a trader you could have netted about 15 ticks per contract on this trade. Each tick is worth $15.625. Please note: the front month for both the ZN and the S&P are now Jun '24. I've changed the format to filled Candlesticks (not hollow) such that it may be more apparent and visible.
Charts courtesy of MultiCharts built on an AMP platform
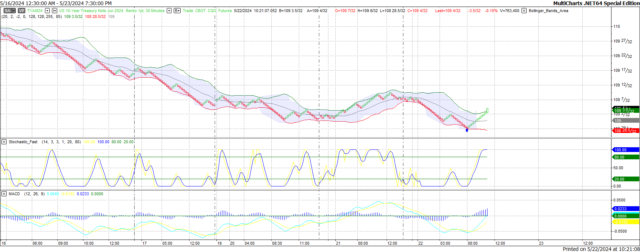
ZN -Jun 2024 - 05/22/24
-638520626115928193.png)
S&P - Jun 2024 - 05/22/24
Bias
Yesterday we gave the markets a Downside bias and the markets didn't disappoint. The Dow closed Lower by 202 points and the other indices closed Lower as well. Today we aren't dealing with a correlated market and our bias is to the Upside.
Could this change? Of Course. Remember anything can happen in a volatile market.
Commentary
Finally, we get a completely correlated market as we suggested a Downside bias yesterday and the markets didn't disappoint. Today we have Unemployment Claims, New Home Sales and an FOMC member speaking so we hope the correlation will continue.
Author

Nick Mastrandrea
Market Tea Leaves


